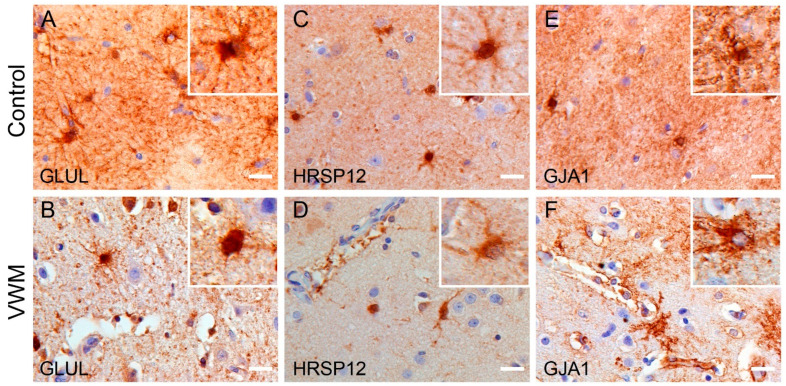
Figure 5.
Expression pattern of GLUL, HRSP12 and GJA1 in control and VWM cortices. (A–F) Immunohistochemistry against GLUL, HRSP12 and GJA1 in control cortex (upper panel) and VWM cortex (bottom panel). Insets are higher magnification images, showing immunoreactive cells with astrocyte-like morphology. Blue stain indicates nuclei. Scale bars: 20 µm. Depicted images are stains of cortical tissue of control 4 and VWM 3.

