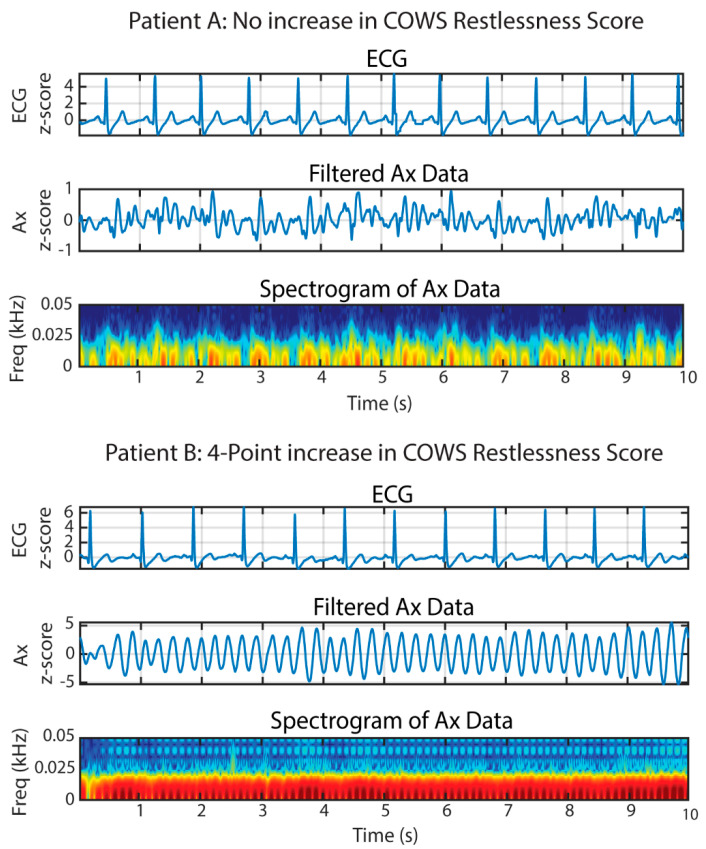
Figure 2.
Spectral analysis of accelerometer waveforms extracted from 10−s windows during the experiment. Patient A represents patients not exhibiting sinusoidal wave patterns and having no increase in their COWS restlessness scores, while Patient B represents patients exhibiting sinusoidal wave patterns and having a four-point increase in their COWS scores. The amplitudes of the electrocardiogram (ECG) and accelerometer signals in the Ax-direction were normalized using z-score normalization as indicated by the y-axes in the figure. All accelerometer waveforms are taken from the craniocaudal direction. The dark red color where the highest energy content is located (and where LBFT is located) is between 0−10 Hz. The other colors such as yellow and blue are low energy noise signals.

