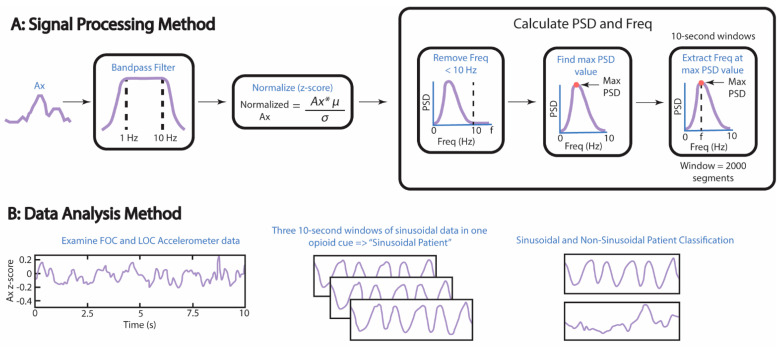
Figure 3.
Methods used to find significant correlations between the COWS scores and the normalized max PSD, as well as the correlations between the frequency at the max PSD and the normalized max PSD. (A) Accelerometer data were normalized using z-score normalization, where µ = mean and σ = standard deviation. The maximum PSD of a 10−s window was normalized to the summation of all PSD values within the same window. Freq = frequency. (B) Processed data were analyzed by visual inspection for sinusoidal patterns in the accelerometer data lasting ≥5 s in a 10−s window. A patient was labeled a “Sinusoidal Patient” if three or more windows containing the aforementioned pattern were found in the first opioid cue (FOC) or last opioid cue (LOC) of their accelerometer data.

