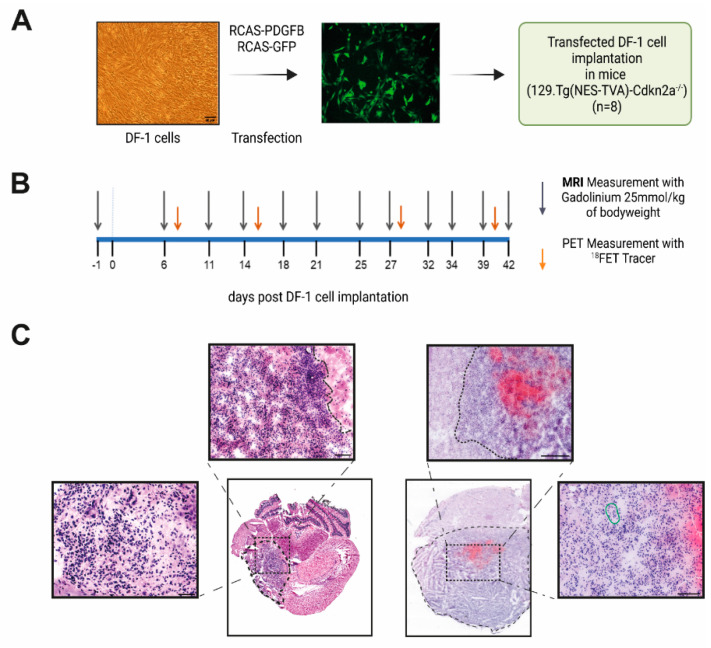
Figure 2.
Longitudinal MRI-FET-PET imaging study and H&E staining pattern. (A) Schematic overview of experimental design. Brightfield image shows transfected DF-1 cells. Scale bar is 50 µm. Representative picture of DF-1 cells transfected with RCAS-GFP plasmid as transfection control. (B) Imaging schedule: day 0 represents the day of implantation of transfected DF-1 cells. (C) Representative images of two animals showing glioma formation. Typical aspects of high-grade glioma, such as infiltrating growth behavior, neovascularization (highlighted in green), and cell atypia, are visible. Boundaries of the tumor core area are highlighted with a dotted line. Scale bars are 50 and 100 µm. (A,B) were created with BioRender.com.

