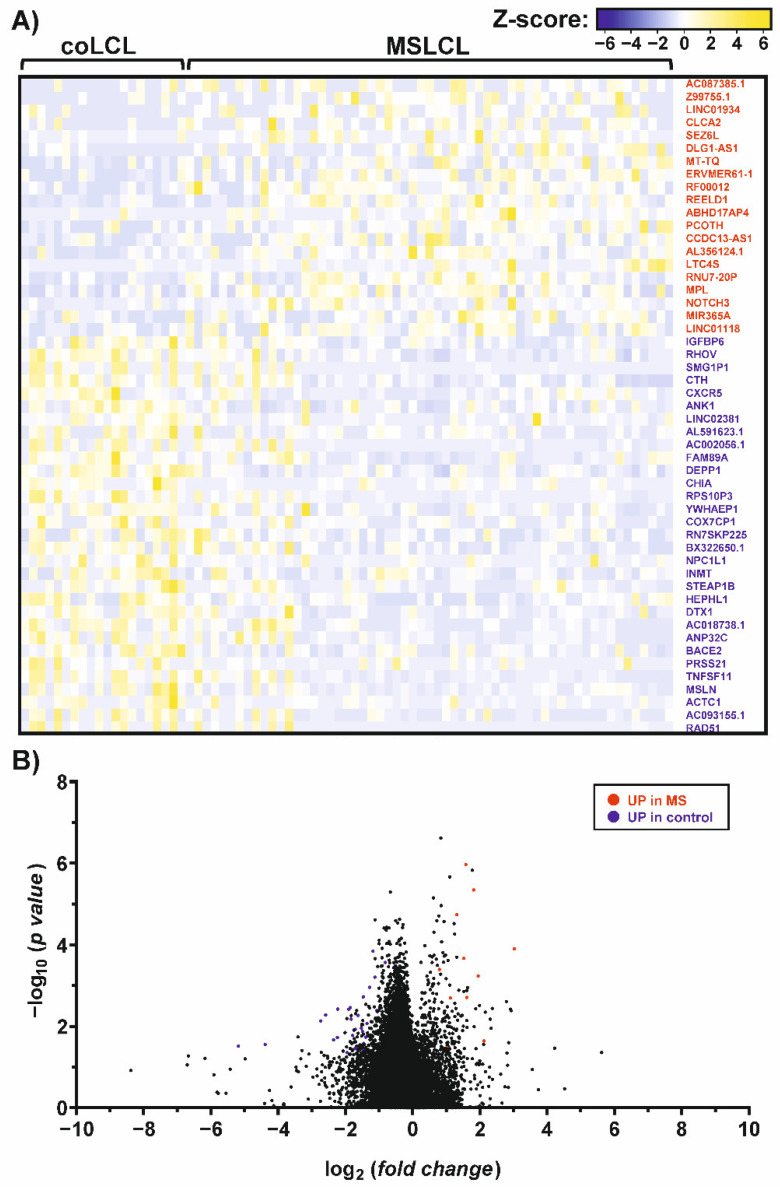
Figure 2.
Differential gene expression patterns in individuals with MS and controls, assessed by RNAseq analysis. The graphs represent a heatmap (A) and a volcano plot (B) of differentially expressed genes (fold change > 1.5, p < 0.05) in MS and controls. Up-regulated genes in MS (red) and controls (blue) were indicated and ranked from highest to lowest fold change in MSLCL. For this analysis, a total of 20 LCL established from controls (coLCL) and 59 LCL from individuals with MS (MSLCL) were used. Human genome version GRCh38/hg38 was used for RNAseq read mapping. Fold changes and statistical significances were listed in the supplement (Supplementary Tables S3 and S4).

