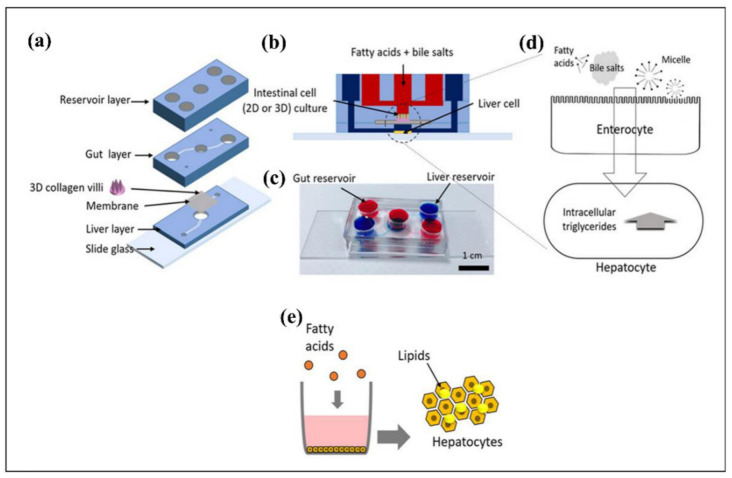
Figure 14.
A schematic of gut-liver chip presented by Lee et al. to recapitulate hepatic steatosis. (a) Representative figure of gut-liver chip, indicating gut layer top of the membrane and liver layer on the bottom of the membrane. (b) Cross-section of the gut-liver chip. (c) An image of an assembled gut-liver chip (blue ink indicates the liver part, whereas red ink indicates the gut part). (d) This figure shows that absorption of fatty acids by gut cells (enterocytes) and liver cells (hepatocytes) in the gut–liver platform. (e) This illustration demonstrates a lipid accumulation experiment in a microwell plate. Cultured hepatocytes (HepG2) in a well plate were exposed to lipid accumulation, and quantification of lipid accumulation was performed. Reprinted with permission from ref. [383], Copyright 2018, Wiley Online Library.

