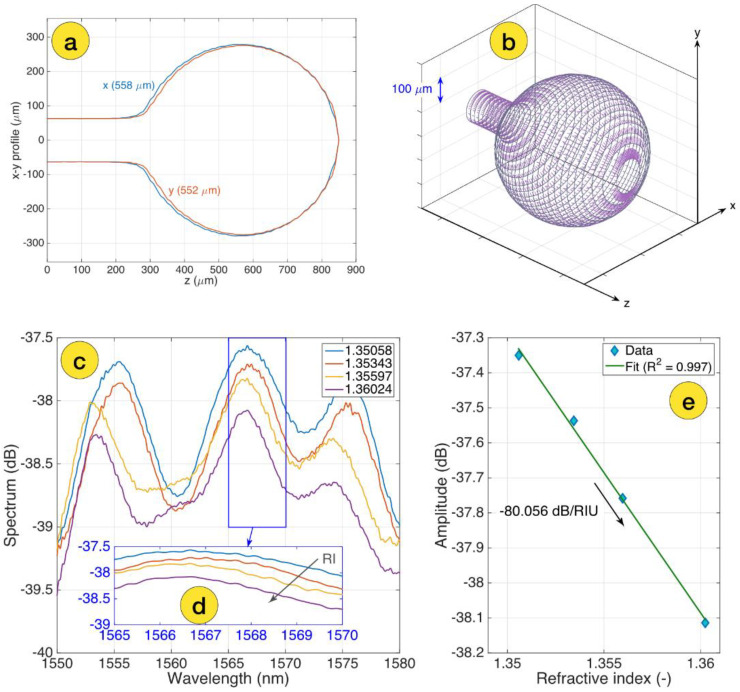
Figure 2.
Design and calibration of the ball resonator biosensor: (a) two-sided profilometry of the ball resonator, measured through the CO2 laser splicer; (b) 3D mesh of the ball resonator, highlighting the longitudinal cross-sections (grey) and azimuthal planes (purple); (c) S-polarization spectrum of the bare ball resonator sensor, measured for different RI values ranging from 1.351 to 1.360; (d) the inset shows the spectral feature around 1567 nm used for spectral tracking of the intensity; (e) RI calibration, showing the change of intensity as a function of the RI change and sensitivity estimation (−80.056 dB/RIU).

