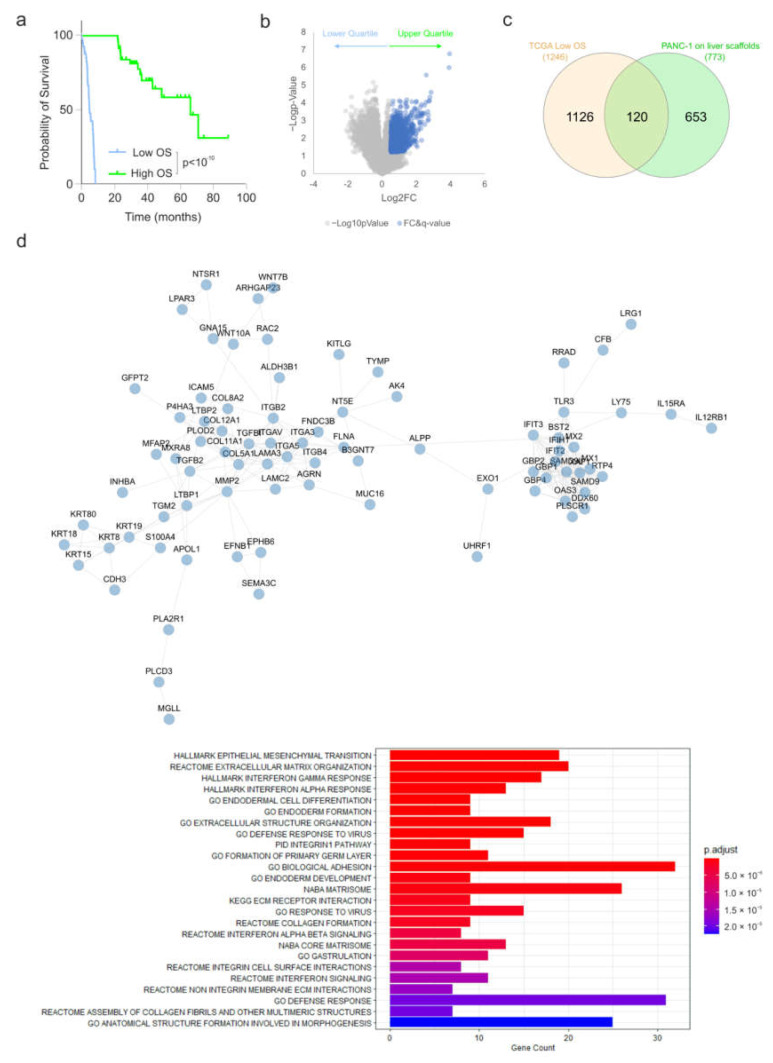
Figure 3.
Identification of genes induced in PANC1 cells on liver scaffolds and those associated with clinically aggressive PDAC. (a) Overall survival (OS) of the upper and lower quartiles of 184 PDAC patients from the TCGA PanCancer Atlas (cBioPortal). (b) Volcano plot of gene expression for patient tumours in the upper and lower quartiles for overall survival from (a). Genes highlighted in blue indicate those showing significantly increased expression (LFC > 0.5, q-value < 0.25). (c) Overlap analysis of genes increased in PANC-1 cells on the liver scaffold compared to the pancreas scaffold and those increased in the tumours of patients displaying poor survival. (d) STRING interaction network for the 120 genes identified in the overlap analysis. Functional enrichment analysis of the 120 genes identified in the overlap analysis is presented. Bar length is analogous to the number of differentially expressed genes in the functional annotation category, while the bar color depicts the adjusted p-value for the hypergeometric test performed.

