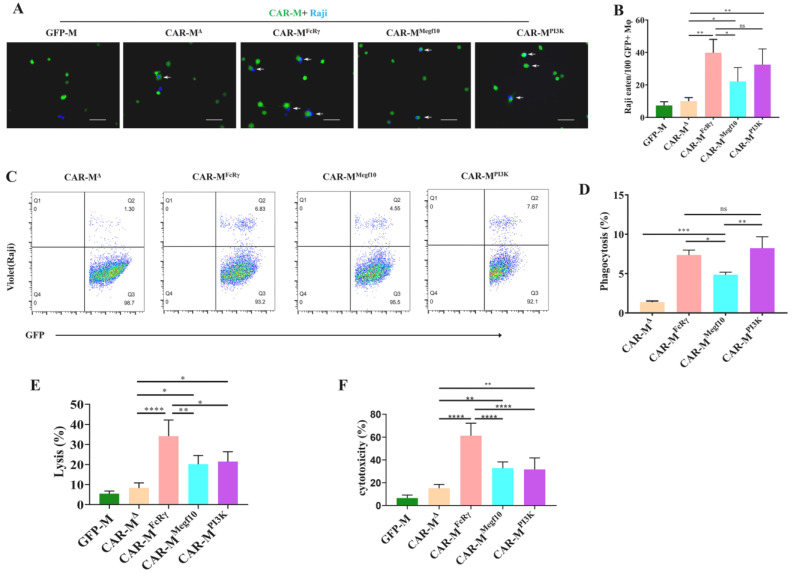
Figure 2.
The comparation of phagocytic and killing capacity of different CAR-Ms. (A) Phagocytosis of Raji by different CAR-Ms was assessed using fluorescence microscopy. Scale bars, 50 μm; CAR-M, green; targets, blue. Photographs are representative of six. (B) Graph depicts pooled data from phagocytosis photographs of panel (A). The results are presented as the number of Raji eaten by 100 GFP+ macrophage (Mφ). All data are means ± SD, n = 6. (C) Phagocytosis of Raji by different CAR-Ms was assessed using flow cytometry. Plots are representative of three. (D) Graph depicts pooled data from panel (C). Quantification of phagocytosis of Raji cells by flow cytometric analysis (n = 3). (E) Luciferase-based killing assay of Raji cell by GFP-M control or CAR-Ms at 48 h. Data represent the mean ± SD of n = 3–4 biological replicates. (F) FACS counting-based killing assay of Raji by GFP-M control or CAR-Ms at 48 h. Data represent the mean ± SD of n = 3 biological replicates. Statistical significance was calculated using one-way ANOVA (* p ≤ 0.05, ** p ≤ 0.01, *** p ≤ 0.001, **** p ≤ 0.0001).

