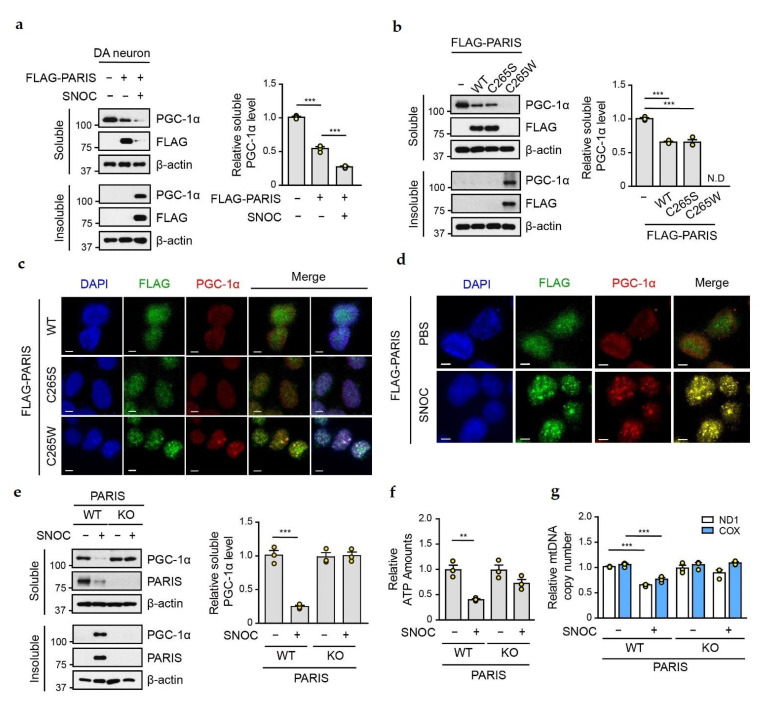
Figure 4.
SNO-PARIS sequesters PGC-1α in the insoluble fraction. (a) Cell lysates from primary DA neurons expressing FLAG-tagged PARIS were incubated with or without SNOC (50 μM) for 30 min and then separated into RIPA-soluble and RIPA-insoluble fractions, followed by immunoblot assay. Right panel, relative PGC-1α level in the soluble fraction normalized to β-actin (n = 3). One-way ANOVA followed by Tukey’s multiple comparison test, *** p < 0.001. (b) Lysates of SH-SY5Y cells overexpressing FLAG-tagged PARIS WT and mutants (C265S, C265W) were separated into RIPA-soluble and RIPA-insoluble fractions, followed by immunoblot assay. Right panel, relative PGC-1α level in the soluble fraction normalized to β-actin (n = 3). One-way ANOVA followed by Tukey’s multiple comparison test, *** p < 0.001. N.D, not detected. (c) Representative immunofluorescence images of the FLAG-tagged PARIS WT and mutants (C265S, C265W) expressing SH-SY5Y cells. PARIS in green and endogenous PGC-1α in red. Scale bar = 5 μm. (d) Representative immunofluorescence images of SNOC (50 μM, 30 min) treated SH-SY5Y cells showing FLAG-tagged PARIS WT (green) and endogenous PGC-1α (red) expression. Scale bar = 5 μm. (e) Lysates of PARIS Knockout (KO) SH-SY5Y cells treated with SNOC (50 μM) for 30 min were separated into RIPA-soluble and RIPA-insoluble fractions, followed by immunoblot assay. Endogenous PARIS and PGC-1α levels were detected with indicated antibodies. Right panel, relative PGC-1α level in the soluble fraction normalized to β-actin level (n = 3). Two-way ANOVA followed by Bonferroni’s post-test, *** p < 0.001. (f) Measurement of relative ATP levels in PARIS KO cells treated with or without SNOC (50 μM) for 30 min using the ENLITEN luciferase assay (n = 3). Two-way ANOVA followed by Bonferroni’s post-test, ** p < 0.01. (g) Relative mitochondrial DNA (mtDNA) copy number in PARIS KO cells treated with or without SNOC (50 μM) for 30 min. NADH dehydrogenase subunit 1 (ND1) and cytochrome C oxidase (COX) levels were normalized to β-actin level, n = 3 per group. Two-way ANOVA followed by Bonferroni post-test, *** p < 0.001.

