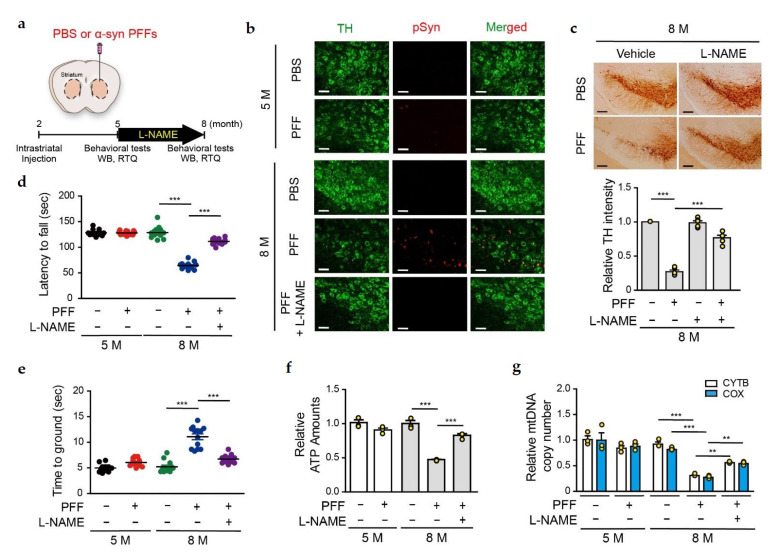
Figure 5.
Nitrosative stress is responsible for DA neuronal cell death and motor dysfunction in α-syn PFFs injected sporadic PD mouse model. (a) Study design for intrastriatal PBS or α-syn PFFs injection. α-syn PFFs (5 μg/mouse) were stereotaxically injected into the striatum of C57BL/6 mice at the indicated time. L-NAME administration and behavioral testing were performed, as indicated in the timeline. All mice were sacrificed after the final behavioral experiments. (b) Representative immunofluorescence images showing TH (green) and phospho-α-syn (red) expression in the SN region of α-syn PFFs injected mice. Scale bar = 50 μm. (c) Representative images showing TH staining of the midbrain sections from the SN region of PBS- or α-syn PFFs-injected mice, with or without L-NAME treatment (6 months post-injection). Scale bar = 200 μm. Bottom panel, relative TH intensity in all mice groups evaluated using the imageJ software. n = 5, One-way ANOVA followed by Tukey’s multiple comparison test, *** p < 0.001. (d) Pole test of PBS- or α-syn PFFs-injected mice treated with L-NAME at the age of 5 and 8 months. n = 13 per group. Two-way ANOVA followed by Bonferroni’s post-test, *** p < 0.001. (e) Rotarod test of PBS- or α-syn PFFs-injected mice at the age of 5 and 8 months. n = 13 per group. Two-way ANOVA followed by Bonferroni’s post-test, *** p < 0.001. (f) Relative ATP levels in the SN region of 5- and 8-month old α-syn PFFs-injected mice evaluated using the ENLITEN luciferase assay. n = 3. Two-way ANOVA followed by Bonferroni’s post-test, *** p < 0.001. (g) Relative mitochondrial DNA (mtDNA) copy number in the SN region of 5- and 8-month old α-syn PFFs-injected mice. Relative levels of cytochrome b (CYTB) and cytochrome C oxidase (COX) normalized to GAPDH levels. n = 3. Two-way ANOVA followed by Bonferroni’s post-test, ** p < 0.01, *** p < 0.001.

