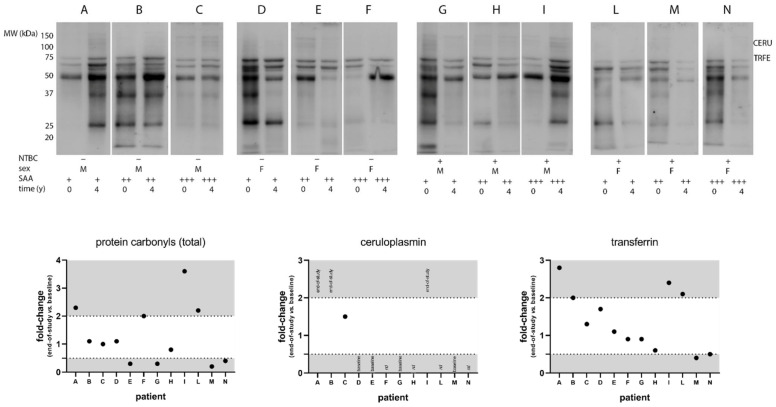
Figure 3.
Analysis of protein carbonyls in a small group of SONIA2 patients’ sera. Baseline and end-of-study samples were selected according to sex, treatment, and SAA levels [low (+) if < 10 mg/L, medium (++) if between 10 and 50 mg/L, and high (+++) if > 50 mg/L]. Representative images from Western blot (upper panel) underwent a semi-quantitative analysis (lower panel) by calculating end-of-study vs. baseline fold-change values on normalized band volumes. Thresholds were set at 0.5 and 2 (dotted lines) for significantly reduced or increased carbonylation, respectively. Total carbonyls and specific proteins whose molecular weight is compatible with that of ceruloplasmin (CERU) and transferrin (TRFE) are reported. For CERU, the labels “end-of-study” and “baseline” indicate carbonylation only at these specific time points; nd: not detected. Additional details on these samples are available in Supplementary Table S4.

