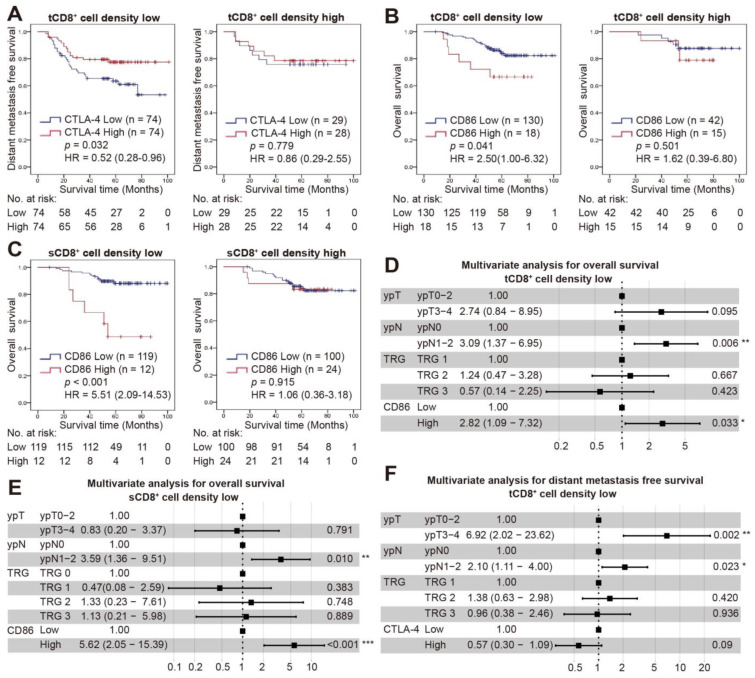
Figure 4.
Combined status of CD8+ cell density and CTLA-4/CD86 expression with survival. (A) Kaplan-Meier curve for DMFS in low or high tCD8+ cell density groups according to CTLA-4 expression. (B,C) Kaplan-Meier curves for OS in low or high tCD8+ (B)/sCD8+ (C) cell density groups according to the CD86 expression. (D–F) Forest plots of PFS and DMFS for variables by multivariate Cox analysis in low tCD8+ (D,F)/sCD8+ (E) cell density groups. *, p < 0.05; **, p < 0.01; ***, p < 0.001.

