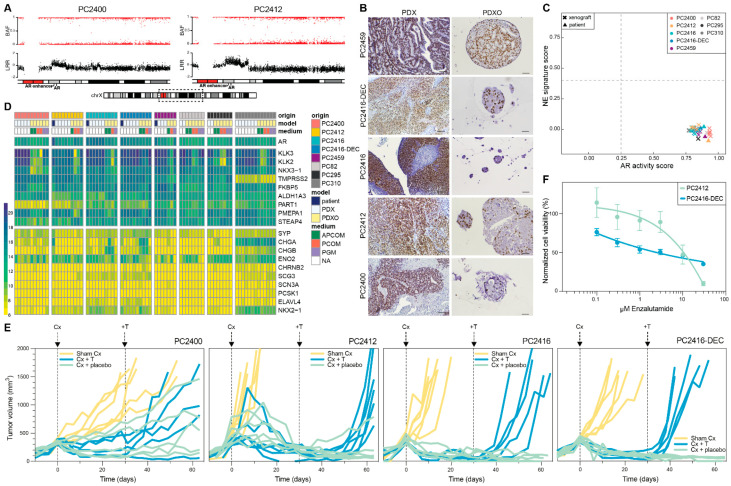
Figure 4.
AR signaling status of CRPC PDXs and PDXOs. (A) B-allele frequency (BAF) and log R ratio (LRR) for the region of interest on chromosome Xq containing the AR gene and upstream AR enhancer, in PDXs PC2400 and PC2412. Dashed box on the chromosome X ideogram indicates the genomic region displayed above. (B) Nuclear AR staining in CRPC PDXs (left panel, scale bars 100 µm) and matching PDXOs (right panel, scale bars 50 µm). (C) Landscape plot of AR activity and NE signature scores in PDX (n = 34) and patient (n = 4) tumors. Thresholds separating samples with low versus high scores are marked with dashed lines. (D) Gene expression heatmap of a curated set of AR and NE marker genes shown across the entire dataset comprising original patient tumors (blue, n = 4), PDXs (white, n = 34) and PDXOs (yellow, n = 39) with different culture medium conditions (green: APCOM; red: PCOM; purple: PGM; white: not applicable (NA)). Expression levels are visualized as vst counts, based on RNA sequencing data. (E) Tumor growth responses after surgical castration (Cx) and testosterone supplementation (+T) in CRPC PDXs. When tumors passed a volume of 300 mm3 (day 0), mice underwent either Cx (blue and green; PC2400 n = 10, PC2412 n = 12, PC2416 n = 11, PC2416-DEC n = 10) or sham Cx (yellow; n = 6 for each PDX). Thirty days after Cx, mice were implanted with a testosterone pellet (blue; PC2400 n = 5, PC2412 n = 6, PC2416 n = 5, PC2416-DEC n = 5) or placebo pellet (green; PC2400 n = 5, PC2412 n = 6, PC2416 n = 6, PC2416-DEC n = 5). (F) Dose-response curves of PC2412 and PC2416-DEC PDXOs exposed to enzalutamide treatment. Dots mark mean and error bars SEM of three and four individual experiments (six technical replicates per condition) for PC2412 and PC2416-DEC PDXOs, respectively. Cell viability was normalized to vehicle (DMSO) controls.

