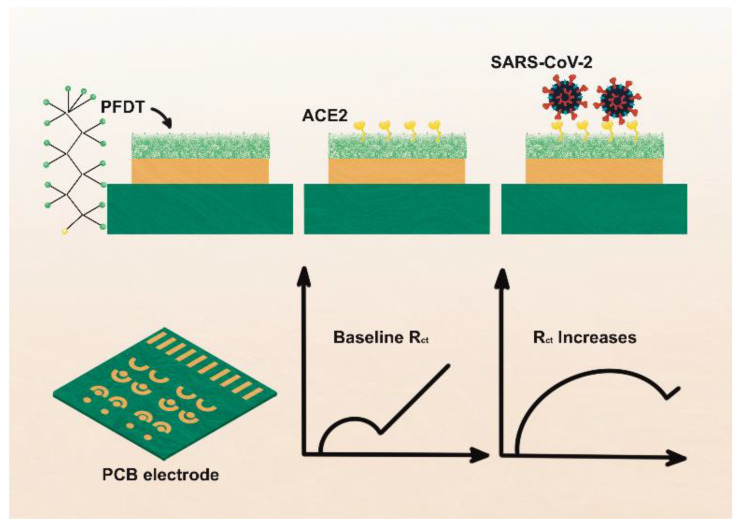
Figure 7.
Schematic representation of the fabrication of PFDT-ACE2 biosensor. Top portion shows the sensor fabrication procedure and bottom part shows sensor signals obtained using electrochemical impedance spectroscopy. PFDT, 1H1H,2H,2H-Perfluorodecanethiol; Rct: Charge transfer resistance. Adapted from Ref. [65] with permission from the Royal Society of Chemistry. This article is licensed under a Creative Commons Attribution 3.0 Unported Licence. https://creativecommons.org/licenses/by/3.0/ (accessed on 21 October 2022).

