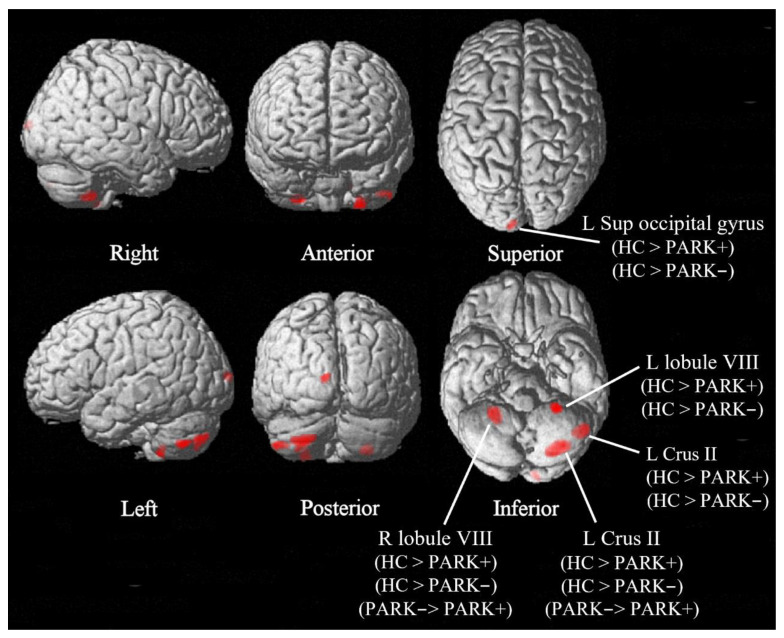
Figure 1.
Voxel-based morphometry (VBM) F-test results comparing healthy controls (HCs) and 22q11.2DS patients with and without parkinsonism (Park+ and Park−). Significant group differences (p < 0.05, family-wise error-corrected, k ≥ 20 voxels) are shown in red on a 3D render of the standard brain (six different views of the render are shown). Post-hoc analysis results are also reported for each cluster of the F-statistic image.

