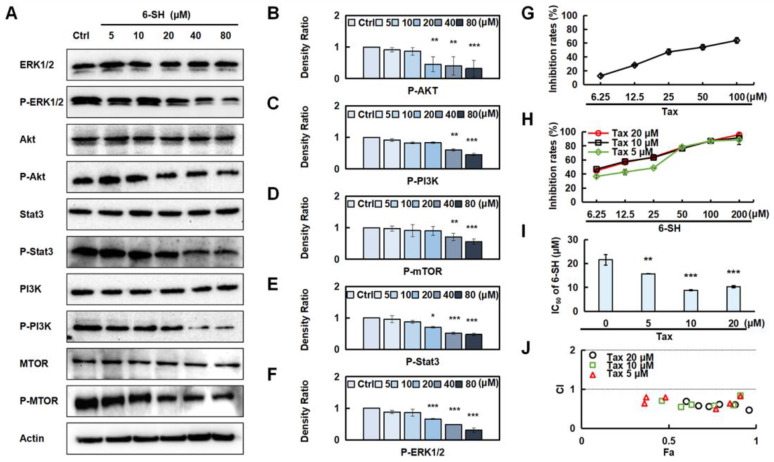
Figure 6.
Validation of 6-SH anti-NSCLC pathway. (A) Cells were treated with 0–80 µM 6-SH for 24 h, and the indicated proteins were assayed. (B–F) Histograms show the density ratio (n = 3). Values represent the means ± SD. * p < 0.05, ** p < 0.01, *** p < 0.001 versus “Ctrl” group. (G–I) Cells were treated with Tax or Tax combined with 6-SH for 72 h, respectively, the inhibition rate and IC50 were assayed. (J) The CI value was calculated. CI values of <1 indicate synergistic effect. Values represent the means ± SD. * p < 0.05, ** p < 0.01, *** p < 0.001 versus “0” group.

