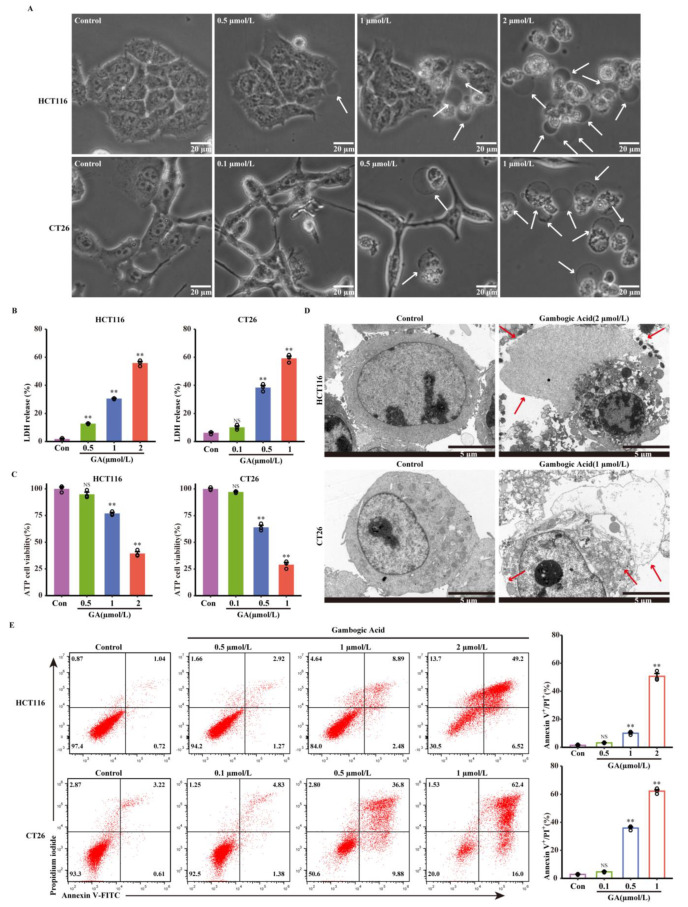
Figure 2.
GA triggered cell pyroptosis in CRC cells. (A) Representative bright-field images of HCT116 and CT26 cells treated with GA for 12 h. The white arrows point to pyroptotic cells. Scale bar: 20 μm. (B) The release of LDH and (C) ATP cell viability after treatment with GA for 12 h. (D) Representative transmission electron microscopy images of HCT116 and CT26 cells treated with GA (2 μmol/L or 1μmol/L) for 12 h. The red arrows indicate the large bubbles, cell membrane breaks, and organelle edema. Scale bar: 5 μm. (E) Flow cytometric analysis of HCT116 and CT26 cells treated with GA for 12 h. The cells were exposed to 0.1% DMSO as control. All experiments were repeated three times and results were expressed as mean ± SD. Con, control. NS, not significant, ** p < 0.01 vs. control.

