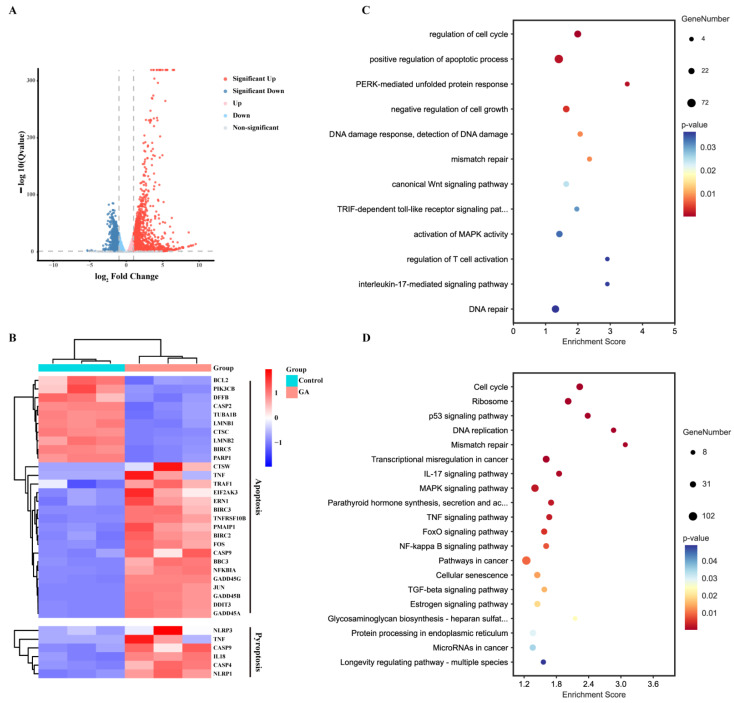
Figure 3.
RNA sequencing analysis. (A) Volcano plots of differentially expressed genes of HCT116 cells in response to 2 μmol/L GA for 12 h. (B) Heatmap analysis of differentially expressed genes involved in apoptosis and pyroptosis. (C) GO and (D) KEGG enrichment in GA-treated HCT116 cells and control cells. The cells were exposed to 0.1% DMSO as control.

