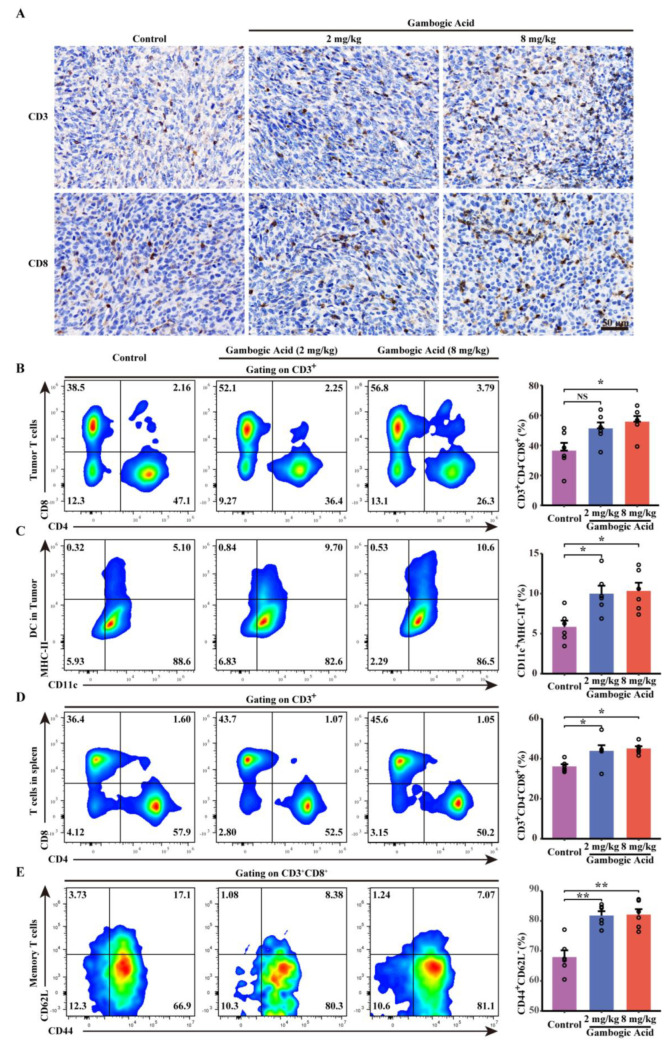
Figure 8.
GA-induced pyroptosis regulates the tumor immune microenvironment. (A) CD3 and CD8 immunohistochemistry analysis of tumor tissues after GA treatments. (B) Representative flow cytometric analysis and quantitative analysis of proportions of CD8+ and CD4+ T cells gating on CD3+ cells within the tumor tissues. (C) Representative flow cytometric analysis that GA treatment significantly increased the proportions of CD3+ and CD8+ T cells in tumor tissues (A) and quantitative analysis the proportion of CD11c+MHC-II+ cells within the tumor tissues. (D) Representative flow cytometric analysis and quantitative analysis of the proportions of CD8+ and CD4+ T cells gating on CD3+ cells in the spleen. (E) Representative flow cytometric analysis and quantitative analysis the proportion of effector memory T cells (TEM) (CD44+ CD62L−) gating on CD3+ CD8+ cells in the spleen. NS p > 0.05 vs. control, * p < 0.05 vs. control, ** p < 0.01 vs. control.

