Figure 2.
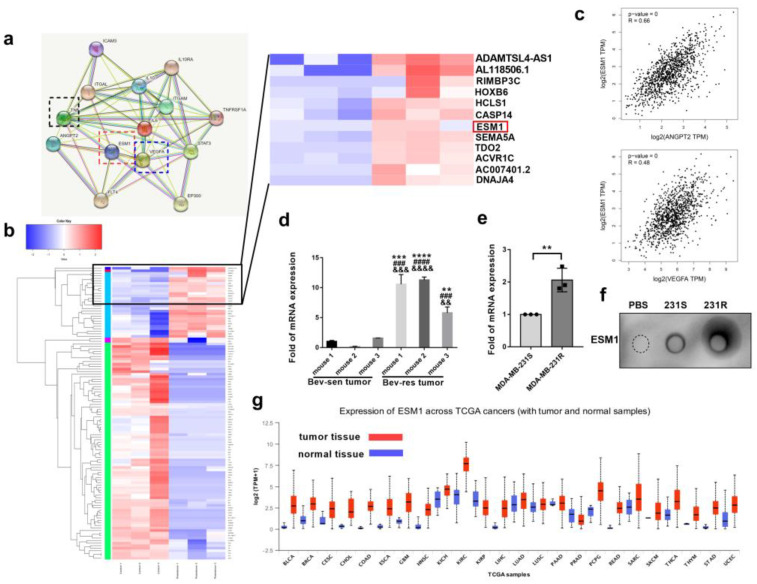
ESM1 is overexpressed in bevacizumab—resistance tumor tissues and cells. (a) Protein interaction network between ESM1 and VEGF/ANGPT2/M2b related cytokines in String Database. (Known interactions: light blue line, from curated databases; purple line, experimentally determined. Predicted interactions: green line, gene neighborhood; red line, gene fusions; blue line, gene co—occurrence. Others: yellow line, text mining; black line, co—expression; light purple line, protein homology.) (b) Expression pattern clustering heat map of MDA-MB-231-S and 231-R cells. (c) Gene correlation of ESM1 with VEGFA or ANGPT2 analyzed by GEPIA Database. (d) qRT—PCR of ESM1 mRNA levels in tumor tissues from bevacizumab sensitive and resistant mice. n = 3/group. ** p < 0.01; *** p < 0.001; **** p < 0.0001, by t test. Bev-res vs. mouse1 of Bev-sen group. ### p < 0.001; #### p < 0.0001, by t test. Bev-res vs. mouse 2 of Bev-sen group. && p < 0.01; &&& p < 0.001; &&&& p < 0.0001, by t test. Bev-resistance vs. mouse 3 of Bev-sensitive group. Error bars represent SD. (e) qRT-PCR of ESM1 mRNA levels in MDA-MB-231-S and MDA-MB-231-R. n = 3/group. ** p < 0.01, by t test. (f) Dot blotting of ESM1 in supernatants of PBS, MDA-MB-231-S, and MDA-MB-231-R under the same conditions. (g) ESM1 levels in tumor tissues and normal tissues in TCGA database.

