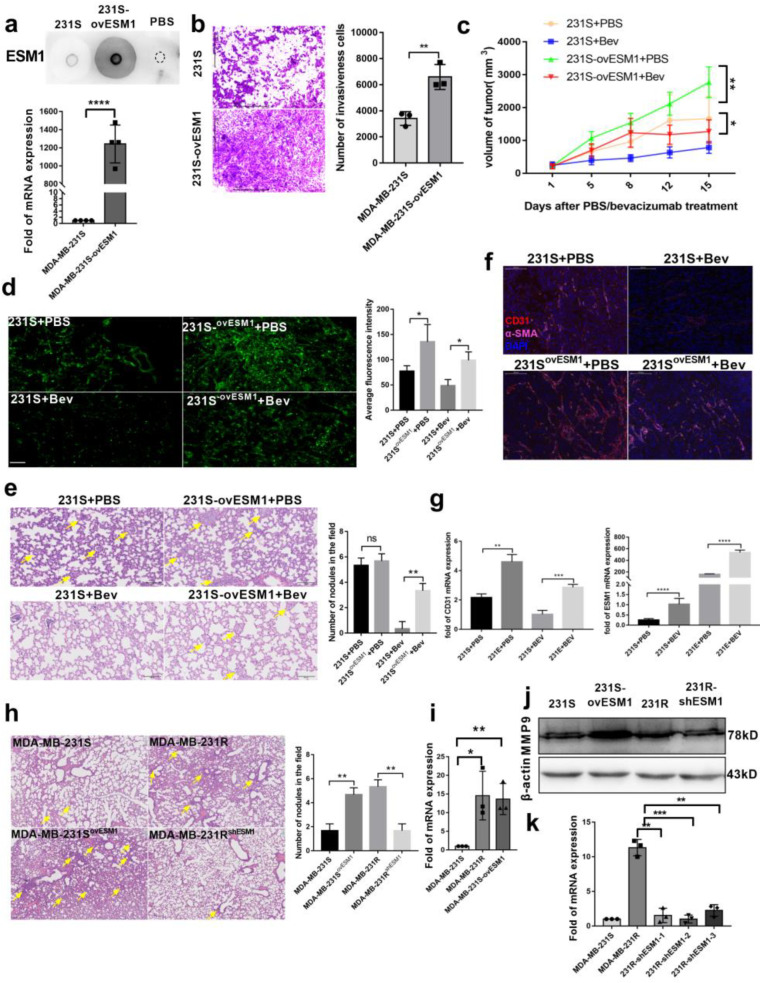
Figure 3.
ESM1 promoted bevacizumab-resistance tumor metastasis. (a) Dot blotting and qRT-PCR of ESM1 levels in MDA-MB-231-S tumor cells with or without overexpressed ESM1. **** p < 0.0001, by t test. (b) Representative transwell invasion images of MDA-MB-231-S and MDA-MB-231-S ovESM1 cells, ** p < 0.01; n = 3/group. Scale bar, 200 μm. (c) Tumor growth volume over time following subcutaneous transplant of MDA-MB-231-S or MDA-MB-231-SovESM1 tumor tissues into nude balb mice. n = 5 for each condition. * p < 0.05; ** p < 0.01 by two-way ANOVA test. Error bars represent SD. (d) Representative images and statistical analysis of MDA-MB-231-S or MDA-MB-231-S ovESM1 lung micro-metastasis treated with PBS or bevacizumab. Scale bar, 100 μm, * p < 0.05 by t test. (e) Representative images and statistical analysis of MDA-MB-231-S or MDA-MB-231-S ovESM1 lung macro-metastasis treated with PBS or bevacizumab. Scale bar, 100 μm, ** p < 0.01 by t test. (f) Representative images of MDA-MB-231-S or MDA-MB-231-S ovESM1 tumor sections from mice treated with PBS or bevacizumab. CD31 was co-stained with α-SMA and nucleus. Scale bar, 50 μm. (g) qRT-PCR of CD31 and ESM1 mRNA levels in MDA-MB-231-S and MDA-MB-231-S ovESM1 formed tumor tissue treated with PBS or bevacizumab in vivo. n = 3/group. **** p < 0.0001, by t test. (h) Representative images and statistical analysis of HE staining to assess the number of lung metastasis in the different treatment groups; scale, 100μm, ** p < 0.01 by t test. (i) qRT-PCR of MMP9 mRNA levels in MDA-MB-231-S, MDA-MB-231-R, MDA-MB-231-S ovESM1 cells. n = 3/group. * p < 0.05; ** p < 0.01, by t test. (j,k) Western blot and qRT-PCR analysis MMP9 in MDA-MB-231-S, MDA-MB-231-R, MDA-MB-231-S ovESM1 and MDA-MB-231-R shESM1 cells. ** p < 0.01; *** p < 0.001, by t test (Figure S1).

