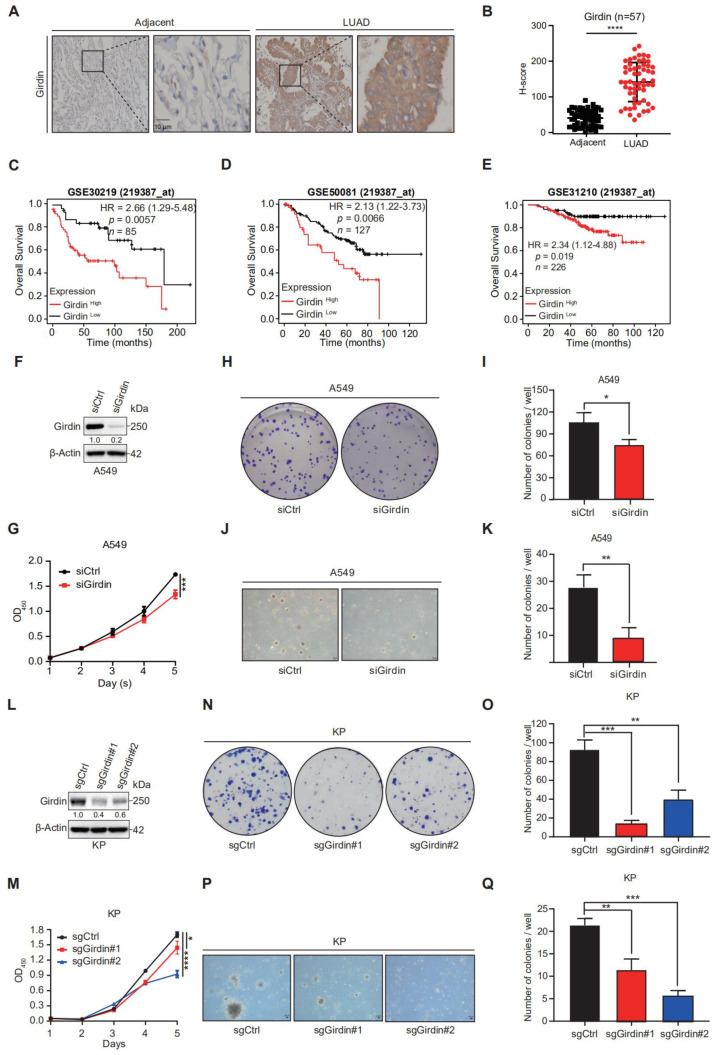
Figure 2.
Girdin ablation inhibits cell proliferation in LUAD. (A,B) IHC staining and statistical analysis of Girdin in human LUAD tissue. Scale bar, 10 μm. n = 57. Data are shown as mean ± SEM (**** p < 0.0001). (C–E) Kaplan–Meier analysis of overall survival was performed based on Girdin expression. GSE 30,219, GSE 50,081, and GSE 31,210 are from the Gene Expression Omnibus (GEO) database. (F) A549 cells were transfected with siCtrl or siGirdin for 72 h and immunoblotted as shown. (G) Effects of siCtrl and siGirdin on cell proliferation were determined by using CCK8 assays with the A549 stable cell line. Data are shown as mean ± SEM (*** p < 0.001). (H,I) Representative images and statistical results of siCtrl and siGirdin for colony formation in the A549 cell line. Data are shown as mean ± SEM (* p < 0.05). (J,K) Representative images and statistical results of siCtrl and siGirdin for soft agar assay in the A549 cell line. Data are shown as mean ± SEM (** p < 0.01). (L) Efficiency of CRISPR/Cas-mediated knockdown of Girdin in KP cells was shown by WB analyses. (M) Effects of sgCtrl and sgGirdin on cell proliferation were determined by CCK8 assays in the KP stable cell line. Data are shown as mean ± SEM (* p < 0.05, **** p < 0.0001). (N,O) Representative images and statistical results of sgCtrl and sgGirdin for clone formation in the KP stable cell line. Data are shown as mean ± SEM (** p < 0.01, *** p < 0.001). (P,Q) Representative images and statistical results of sgCtrl and sgGirdin for soft agar assay in the KP stable cell line. Data are shown as mean ± SEM (** p < 0.01, *** p < 0.001).

