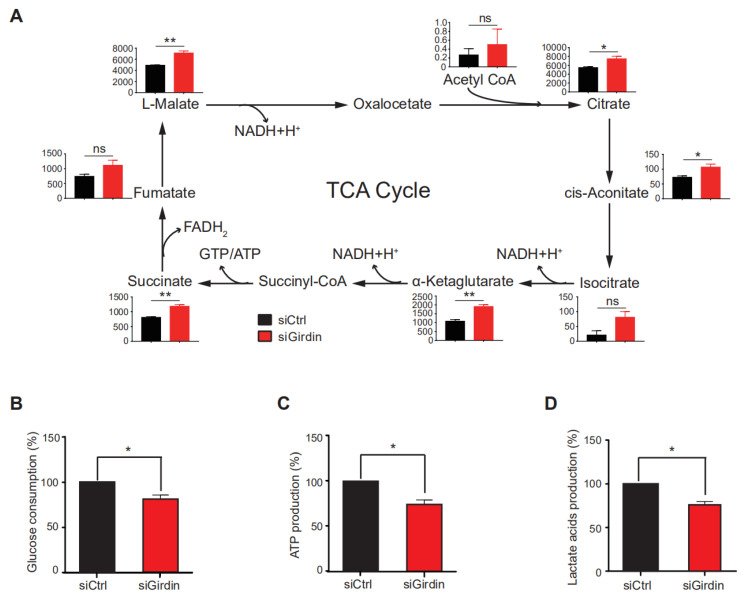
Figure 3.
Girdin participates in TCA cycle and glycolysis regulation. (A) Metabolomic analysis of cells incubated for 24 h after transfection with indicated siRNAs for 48 h and then labeled with D-(13C6) glucose. The amounts of the indicated metabolites of the TCA cycle were measured (ns, not significant, * p < 0.05, ** p < 0.01). (B) Glucose consumption in A549 cells transfected with siRNAs (* p < 0.05). (C) ATP production in A549 cells transfected with siRNAs (* p < 0.05). (D) Lactate acid production in A549 cells transfected with siRNAs (* p < 0.05).

