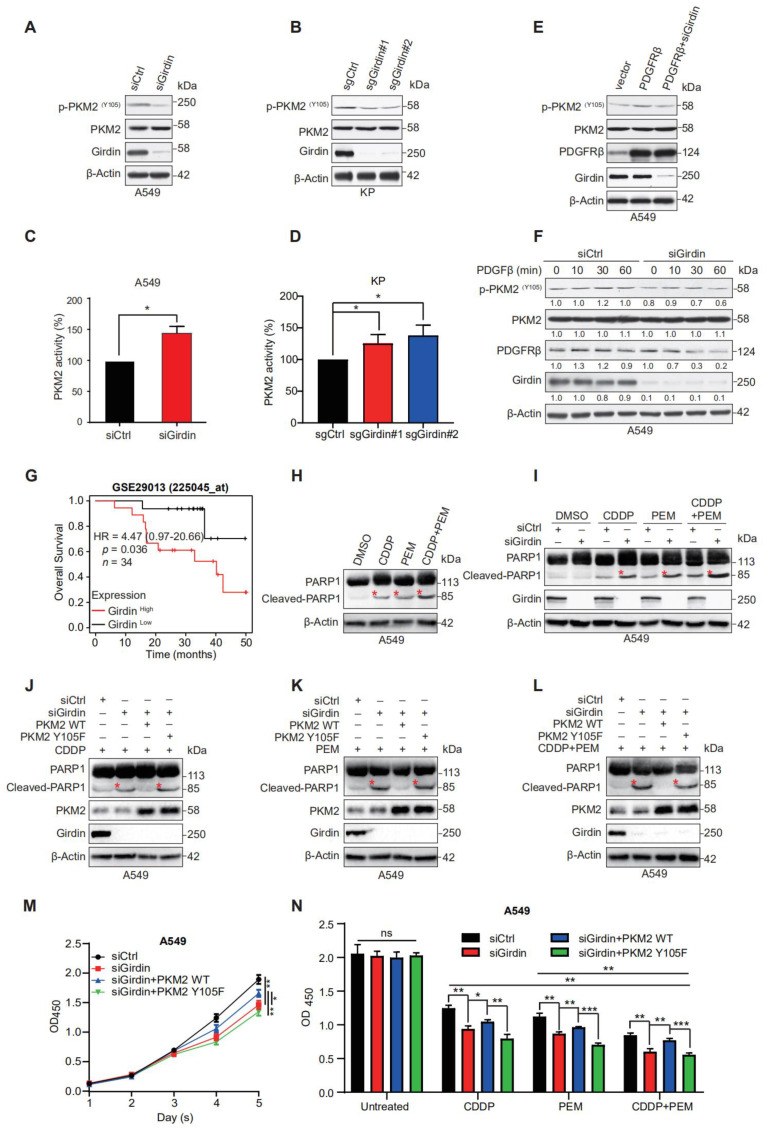
Figure 5.
Girdin develops chemoresistance via PKM2. (A,B) The phosphorylation levels of PKM2 were assessed by WB using anti-p-PKM2 (Tyr 105) antibodies. Cell extracts from A549 cells transfected with siRNAs for 72 h (A) and the KP-Girdin KO stable cell line (B). (C,D) PKM2 kinase activity was detected in A549 and KP cell lines with siRNA or sgRNAs (* p < 0.05). (E) The phosphorylation levels of PKM2 were assessed after vector or PDGFRβ plasmids or PDGFRβ plus siGirdin was transfected for 48 h in the A549 WT cell line. (F) Control or Girdin-interfering A549 cells were treated with PDGβ for the indicated time points, followed by WB analysis of p-PKM2, p-PDGFRβ, Girdin, and PKM2 with cell lysates. (G) Overall survival (OS) after chemotherapy in NSCLC patients with low and high expression of Girdin; data from the Kaplan-Meier plotter. (H) A549 WT cells were treated with CDDP (10 μM), PEM (2 μM), and “CDDP + PEM” for 48 h; WB analysis of indicated proteins in the cell lysates was performed. (I) A549 cells were transfected with siRNAs for 24 h and then treated with CDDP (10 μM), PEM (2 μM), or “CDDP + PEM” for 48 h. WB analysis of indicated proteins in the cell lysates was performed. (J–L) A549 cells stably expressing PKM2 WT or the PKM2 Y105F mutant were transfected with siRNAs for 24 h and then treated with CDDP (10 μM), PEM (2 μM), or “CDDP + PEM” for 48 h. WB analysis of indicated proteins in the cell lysates was performed. The red asterisks in (H–L) indicated the cleaved bands of PARP1 after inducing with corresponding chemotherapeutics. (M) CCK8 assay was performed in A549 cells transfected with siCtrl, siGirdin, siGirdin+ PKM2 WT, or siGirdin + PKM2 Y105F (* p < 0.05, ** p < 0.01). (N) Cell survival assay was conducted in cells transfected the same as (M), but cells were treated with CDDP (10 μM), PEM (2 μM), or “CDDP + PEM” for 48 h (ns, not significant, * p < 0.05, ** p < 0.01, *** p < 0.001).

