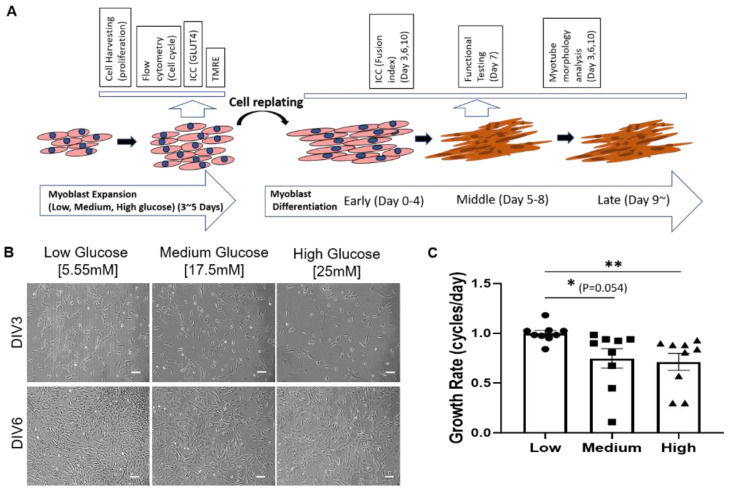
Figure 1.
Effect of hyperglycemia on iPSC-derived myoblast proliferation. (A) Schematic illustration of iPSC-derived myoblast culturing and differentiation timeline, and the experiments at different stages. (B) Phase images of iPSC-derived myoblasts in 5mM, 17.5mM and 25mM of glucose at days 3 (Days in vitro or DIV 3) and 6 (DIV 6) of proliferation. (C) Graph showing primary myoblasts proliferation rate in varying glucose concentration. Scale bar = 100 µm. Error bar: SEM. p-value P ≤ 0.1, *; P ≤ 0.05, **; P ≤ 0.01, ***. n = 5 in 2 experiments. Statistics was performed utilizing One-way ANOVA with post-hoc Tukey HSD Test by comparing between each hyperglycemia group with the euglycemic control group.

