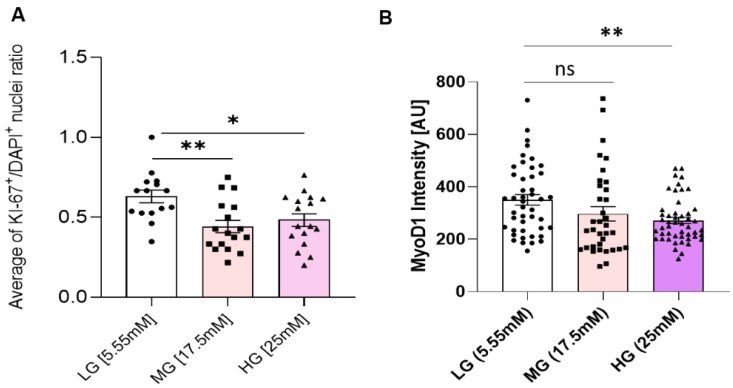
Figure 3.
Proliferation and Myogenicity assessment. (A) Ratio of KI-67+/DAPI+ nuclei in iPSC-derived myoblasts cultured in euglycemic (5.55 mM) compared to hyperglycemic (17.5 mM, 25 mM) conditions. (B) Mean MyoD expression intensity quantification in euglycemic (5.55 mM) versus hyperglycemic (17.5 mM, 25 mM) myoblasts. Error bar: SEM. P ≤ 0.1, *; P ≤ 0.05, **; P ≤ 0.01, ***. A total of 15 imaging areas (covering more than 200 cells) from 2 experiments for each glucose condition were analyzed. Statistics was performed utilizing One-way ANOVA with post-hoc Tukey HSD Test.

