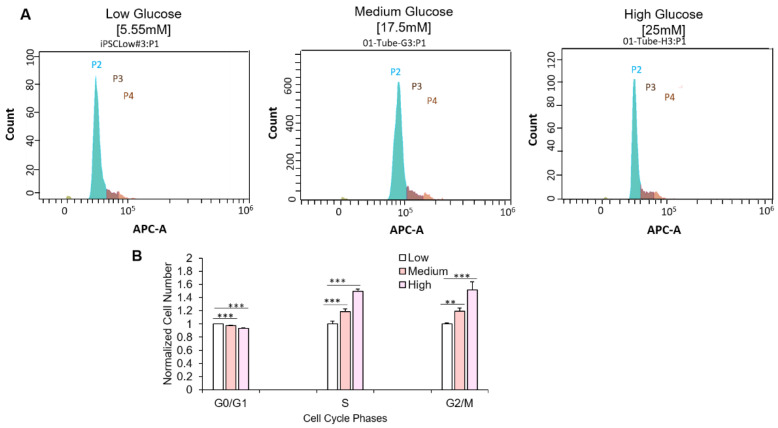
Figure 4.
Effect of hyperglycemia on cell cycle progression. (A) Pictograph showing iPSC-derived -myoblast distribution among the various cell cycle phases in each glucose concentration (P2, green: G0/G1 phase; P3, dark brown, S phase; P4, light brown, G2/M phase). (B) Quantification of iPSC-myoblasts at the various phases of cell cycle in 5.55 mM, 17.5 mM and 25 mM D-glucose conditions. Data was normalized to the cell count of each phase at euglycemic condition. Error bars = SEM. P ≤ 0.1, *; P ≤ 0.05, **; P ≤ 0.01, ***. n = 10. Statistics was performed utilizing One-way ANOVA with post-hoc Tukey HSD Test.

