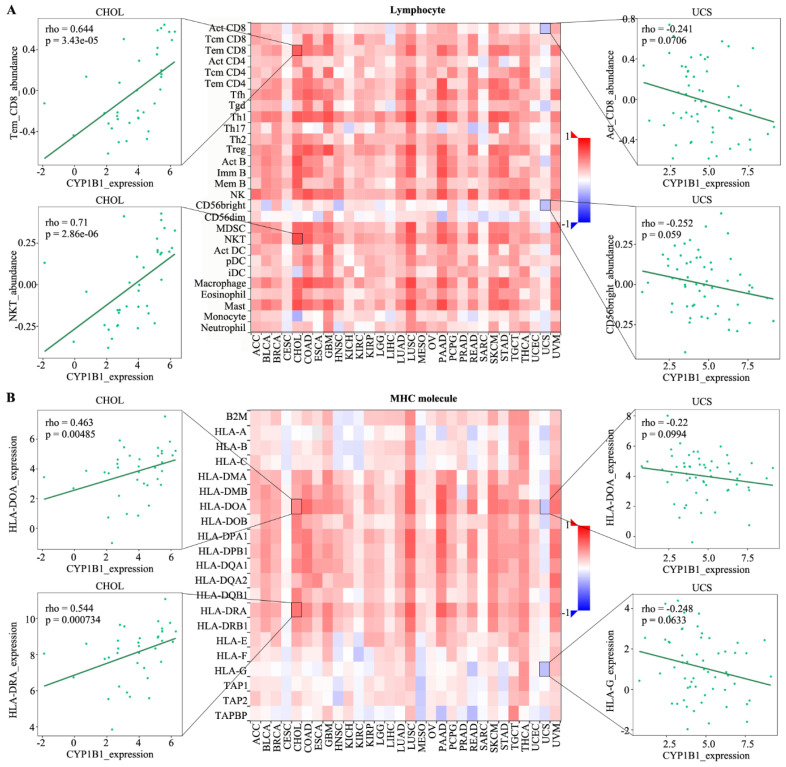
Figure 2.
The correlations between CYP1B1 expression and lymphocyte and MHC molecule. (A) The spearman correlations between CYP1B1 expression and lymphocyte in cancer. (B) The spearman correlations between CYP1B1 expression and MHC molecule in cancer. The heatmap represents rho value. Red color means positive correlation, blue color means negative correlation. Four associations were showed by dot plots.

