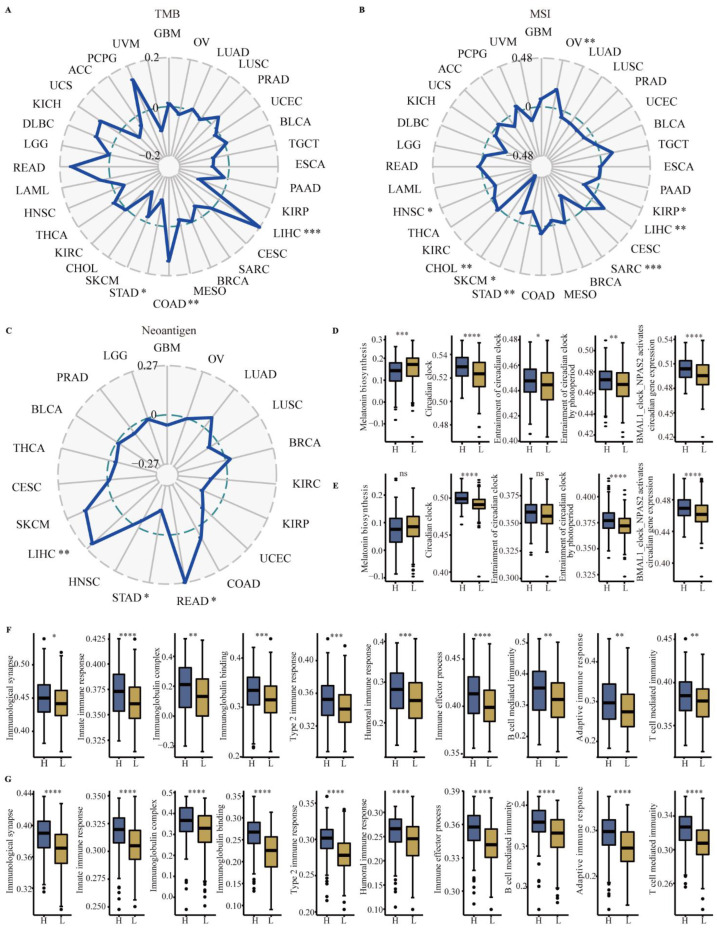
Figure 4.
The correlations between CYP1B1 expression and TMB, MSI, neoantigen, and immune-related pathways. (A) Correlations between CYP1B1 expression and TMB in cancer. (B) Correlation between CYP1B1 and MSI in cancer. (C) Correlation between CYP1B1 and neoantigen in cancer. (D,E) The melatonin-related pathways enriched by ssGSEA analysis in LIHC (D) and STAD (E). (F,G) The classical immune related pathways enriched by ssGSEA analysis in LIHC (F) and STAD (G). Two groups (High-expression and Low-expression) of pathway scores with boxplots using the Mann-Whitney U test. * p < 0.05; ** p < 0.01; *** p < 0.001; **** p < 0.0001.

