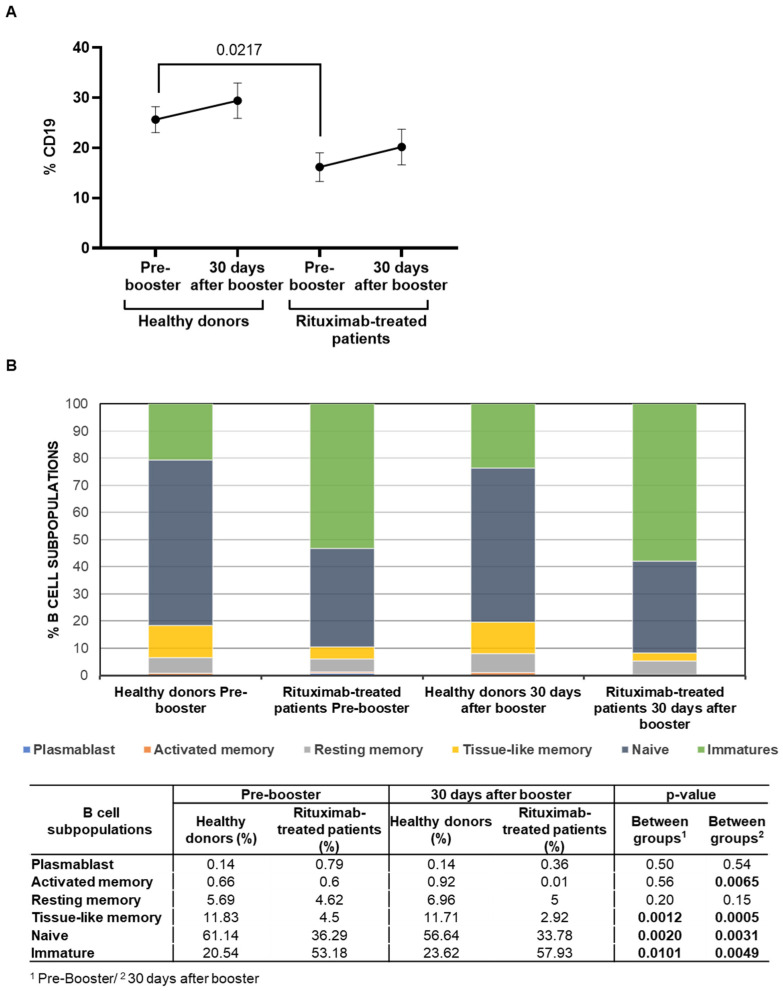
Figure 2.
Total levels of B cells and distribution of B-cell subpopulations in PBMCs of rituximab-treated patients and healthy donors before and after receiving the booster dose. (A) Total levels of B cells (CD19+) in PBMCs of patients treated with rituximab and healthy donors before and after receiving the booster dose of COVID-19 vaccine. Each dot in the graphs corresponds to the mean ± SEM. Statistical significance was calculated using the Mann–Whitney test. (B) Analysis of the distribution of B-cell subpopulations in PBMCs of patients treated with rituximab and healthy donors before and after receiving the booster dose of COVID-19 vaccine. Mean data are represented in bar graphs. Data in the table show the statistical significance between groups that was calculated using Mann-Whitney test.

