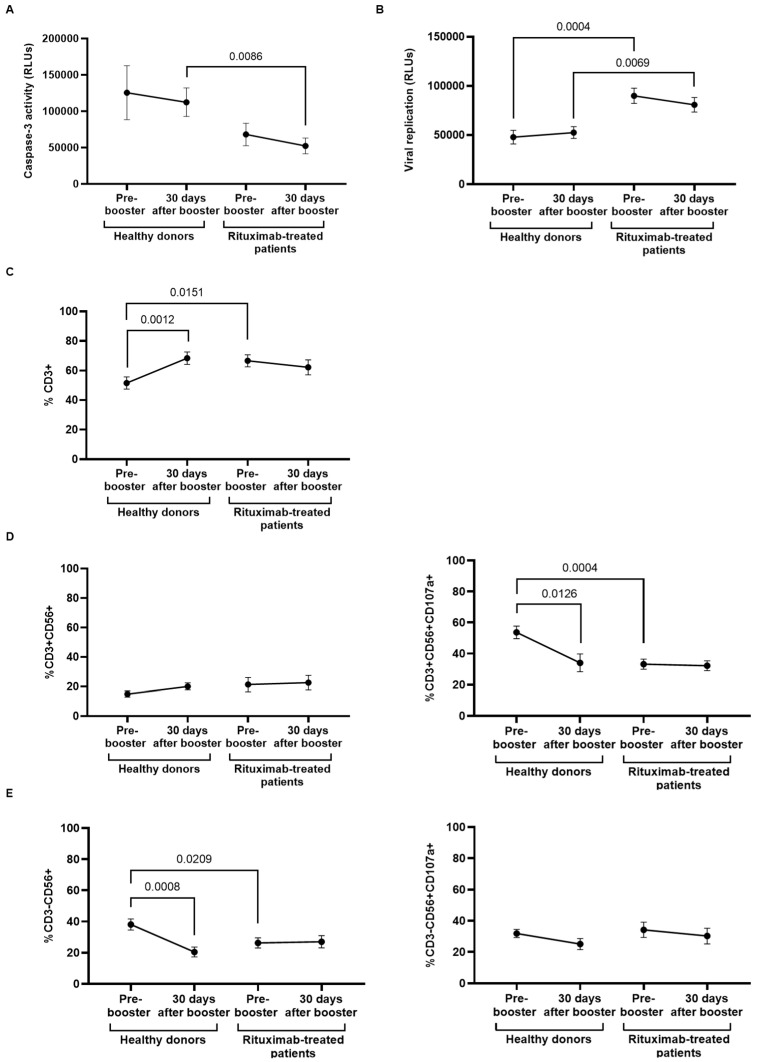
Figure 4.
Analysis of DCC response of PBMCs from rituximab-treated patients and healthy donors before and after receiving the booster dose of COVID-19 vaccine. (A) DCC was assessed by measuring the activity of caspase-3 in pseudotyped-SARS-CoV-2-infected Vero E6 cells cocultured with PBMCs from rituximab-treated patients in comparison with healthy donors before and after the booster dose. (B) The capacity of PBMCs from both cohorts to eliminate pseudotyped SARS-CoV-2-infected Vero E6 cells was determined by quantifying the production of renilla (relative light units, RLUs) after coculture for 1 h. (C) Total levels of CD3+ T cells in individuals of both cohorts that were present in the supernatant of the coculture. (D) Total levels of NKT-like cells (CD3+CD56+) (left graph) and NKT-like cells expressing the degranulation marker CD107a (CD3+CD56+CD107a+) (right graph) in PBMCs from individuals of both cohorts. (E) Total levels of NK cells (CD3−CD56+) (left graph) and NKT-like cells expressing the degranulation marker CD107a (CD3−CD56+CD107a+) (right graph) in PBMCs from individuals of both cohorts. Each dot in the graphs corresponds to the mean ± SEM. Statistical significance between groups was calculated using the Mann–Whitney test, and statistical significance within groups was calculated using the Wilcoxon signed-rank test.

