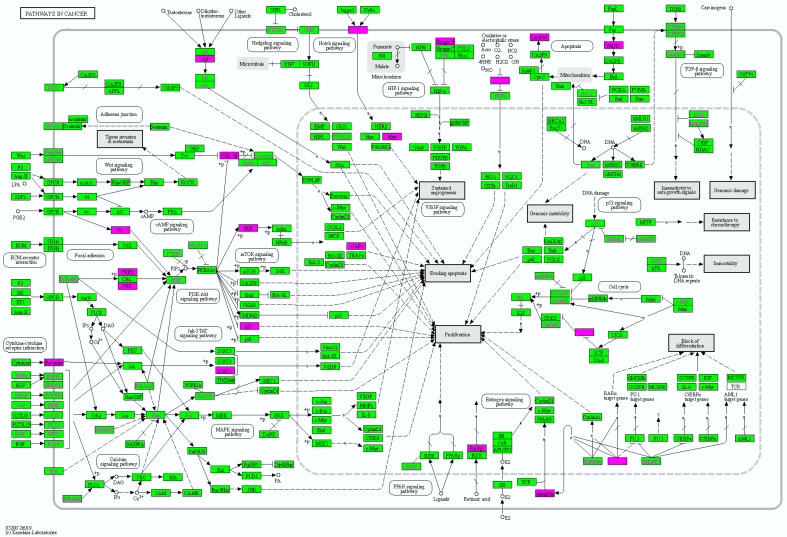
Figure 3.
Enriched pathway visualization with KEGG Mapper Color. DEG-mapped pathway visualization presented that DEGs were mainly involved in “Signal transduction metabolism”, such as the PI3K/Akt, JAK/STAT, and Notch signaling pathways, and were specifically enriched in “PI3K/Akt signaling pathway”. All pathways were directed towards “Sustained Angiogenesis”, “Evading Apoptosis”, and “Proliferation”.

