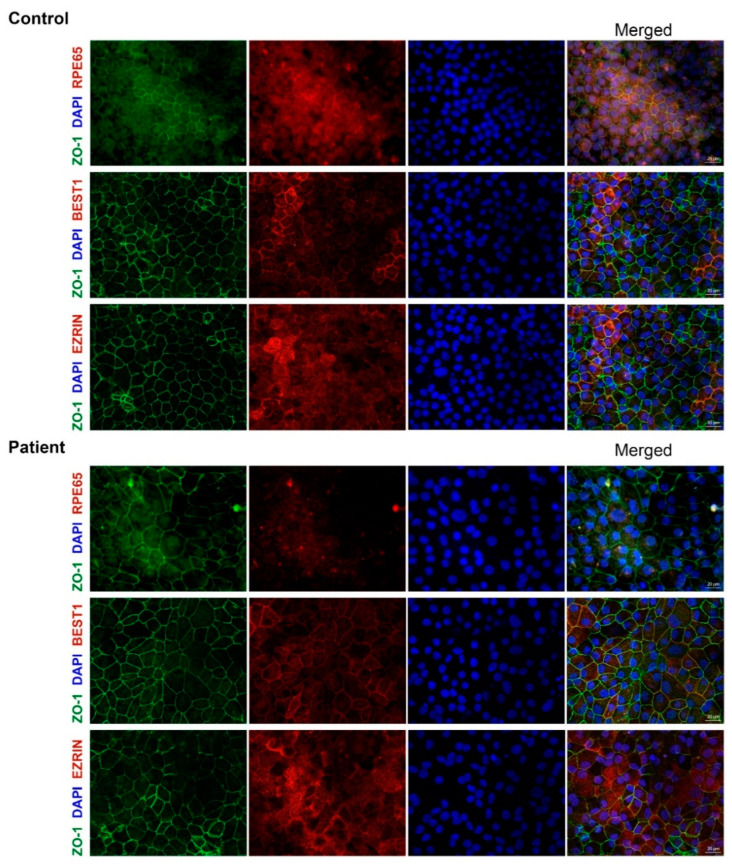
Figure 4.
Immunocytochemical analysis of control and patient-derived RPE cells. P3 RPE cells were analyzed by ICC using several markers. In all case ZO-1 (green) stains the tight-junctions and DAPI (blue) stains the nuclei. In red, different RPE markers were assessed: RPE65 (first row), BEST1 (second row) and EZRIN (third row). Each channel is depicted individually and the merged is provided in the last column. Scale bar represents 20 μm.

