Figure 5.
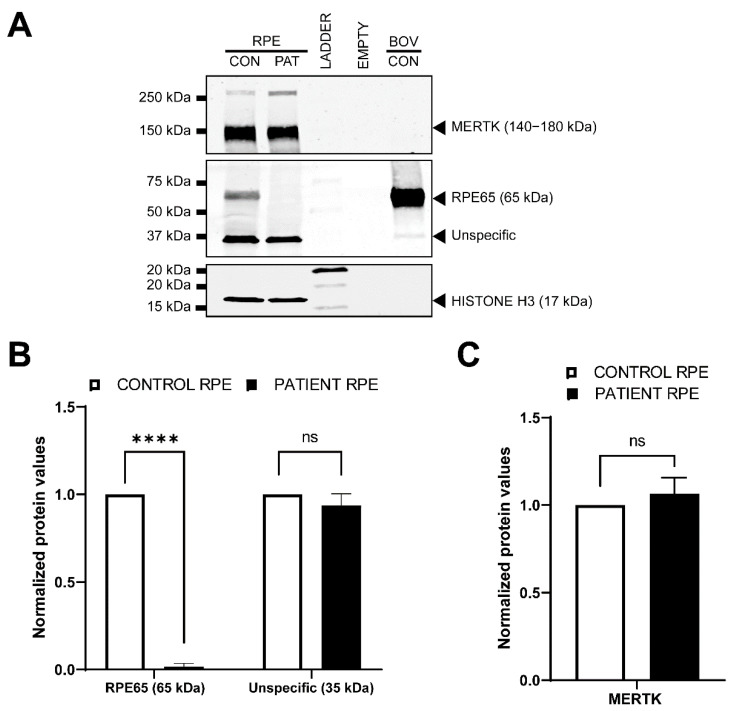
Western blot analysis in RPE cells. (A) Representative Western blot on P3 RPE cells. The upper panel depicts the immunodetection of the RPE marker MERTK. The middle panel shows the detection of RPE65, which expected size is 65 kDa. Bovine control (BOV-CON) was employed as a positive control. The lower panel represent HISTONE H3, which was used as loading control. Of note, MERTK and HISTONE H3 antibodies do not react with the bovine protein. (B) Quantification (n = 2) of the two bands detected on the middle panel (RPE65). Patient RPE cells present a significant reduction in RPE65 protein amount in comparison with the control RPE cells. There were no differences for the levels of the ~35 kDa protein levels. (C) Quantification (n = 2) of the protein levels of the RPE marker MERTK. Statistically differences by one-way ANOVA test are indicated as **** p < 0.00001 or ns: not-significant.

