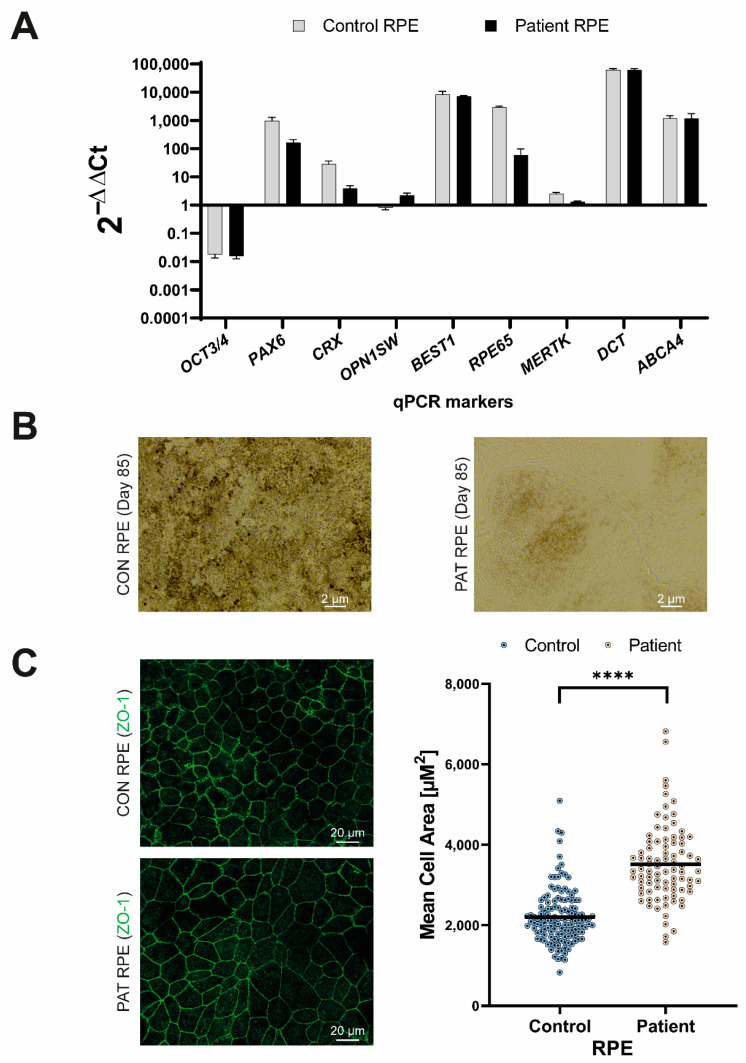
Figure 6.
Characterization of the RPE differentiation. (A) Gene expression profile at the end of the differentiation process. P3 RPE cells were compared to iPSCs (day 0 of differentiation). The differentiation into RPE is observed by the expression levels of BEST1, MERTK, RPE65 and DCT. (B) Bright-field image of the control (CON) and patient (PAT)-derived RPE at P3. Pigmentation is clearly observed in the CON RPE line. Scale bar represents 2 μm. (C) On the left panels, representative immunocytochemical images stained for ZO-1 (in green) which marks the tight junctions. Scale bar indicates 20 μm. On the right panel, scatter plot of the cell area (μM2) of every quantified cell based on the ZO-1 staining pictures using Wimasis Image analysis software. The average size for control and patient RPE cells is represented by a black line. Statistically differences by two sample T-test are indicated as **** p < 0.00001.

