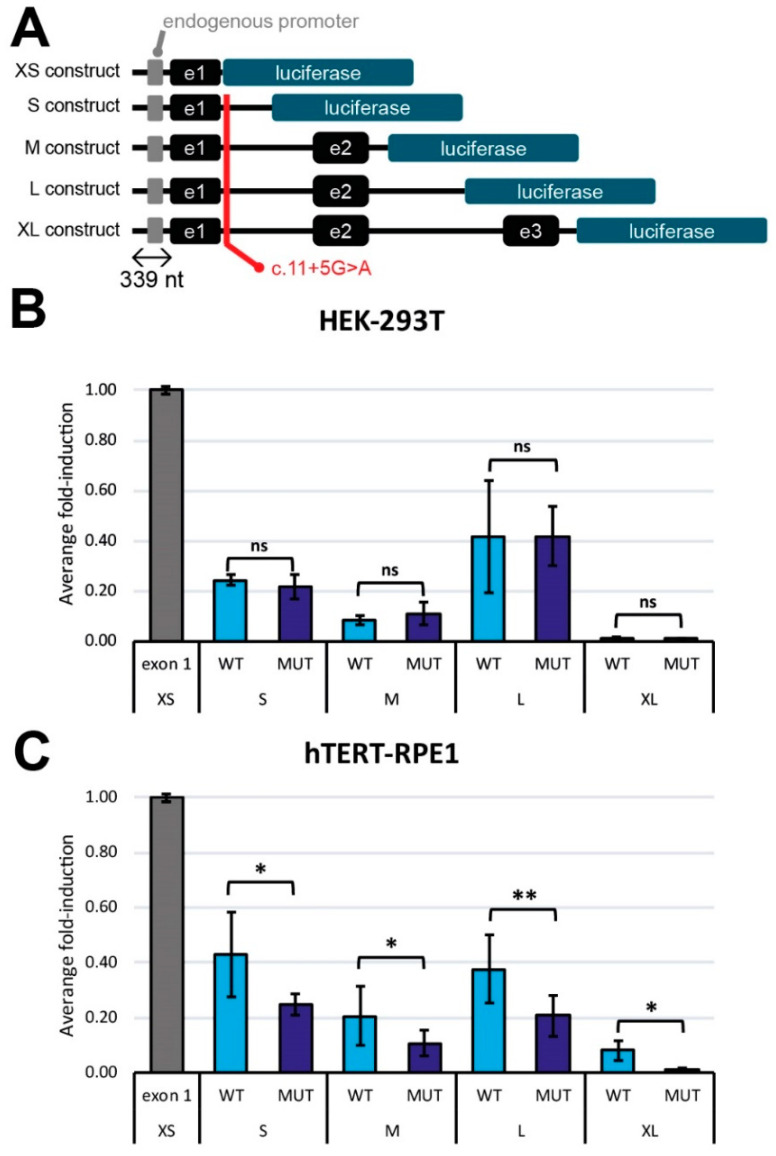
Figure 7.
Expression analysis using luciferase assays. (A) Schematic representation of the different luciferase constructs and the position of the c.11+5G>A mutation. All constructs contain the 339 nt upstream region from the exon 1. (B,C) are a comparison of the average fold-induction between the wildtype transcripts (WT) and the ones harboring the mutation (MUT) in HEK-293T (B) and hTERT-RPE1 (C) (n = 4). Each bar represents the mean value in percentage ± SD. Statistical differences with respect the negative control (XS construct) by one-way ANOVA test are indicated as * p < 0.05 and ** p < 0.01 or ns: not-significant.

