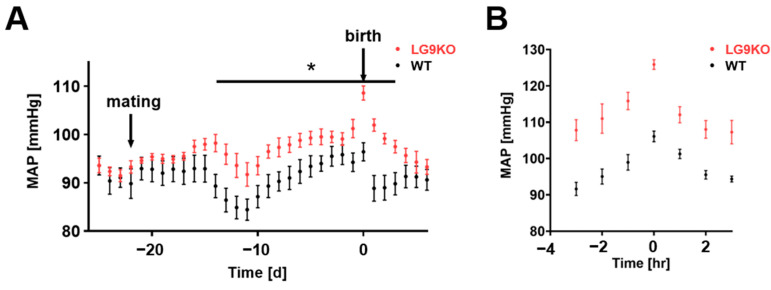
Figure 1.
Time course of blood pressure values with and without hyperuricemia: (A) Blood pressure diagram of WT (black, n = 7) and LG9KO (red, n = 8) animals during gestation. Each point represents a 24 h average of the mean arterial pressure ± SEM. At day eight of gestation, the mean arterial pressure of the LG9KO animals’ increases compared to the WT group; this difference disappears at day 5 after birth. (B) One-hour averages (indicated timepoint ± 30 min) of peripartal blood pressure. A difference of 19 mmHg was observed between LG9KO and WT groups at the time of birth (t = 0). * p < 0.05.

