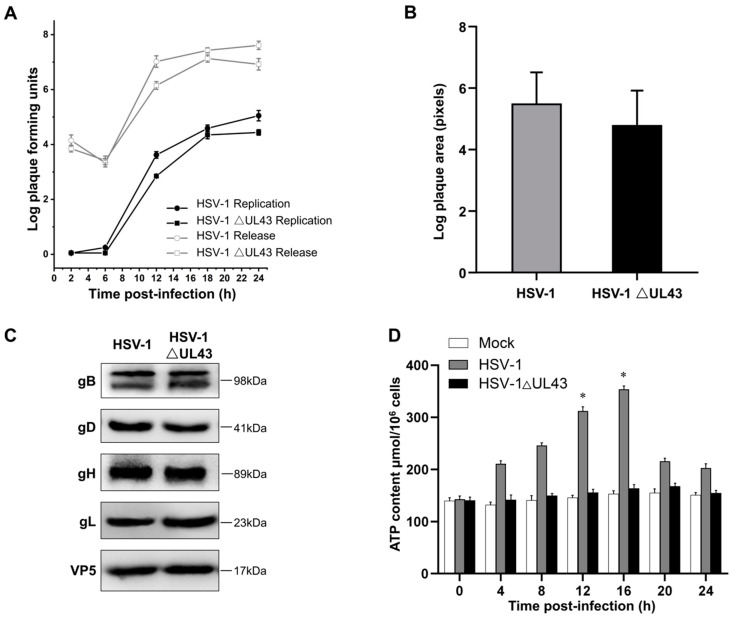
Figure 1.
Growth and spread of viruses and viral glycoprotein expression levels in infected cells. (A) Single-step growth and supernatant virus curves for HSV-1 and HSV-1 △UL43 on HUVEC cells. (B) Sizes of plaques formed by HSV-1 and HSV-1 △UL43 on HUVEC cells. Data from one of three representative experiments are shown. (C) Western blot analysis of viral glycoprotein expression levels in infected cells. (D) ATP content assay of Mock, HSV-1 and HSV-1 △UL43. *: p < 0.05 vs. other groups.

