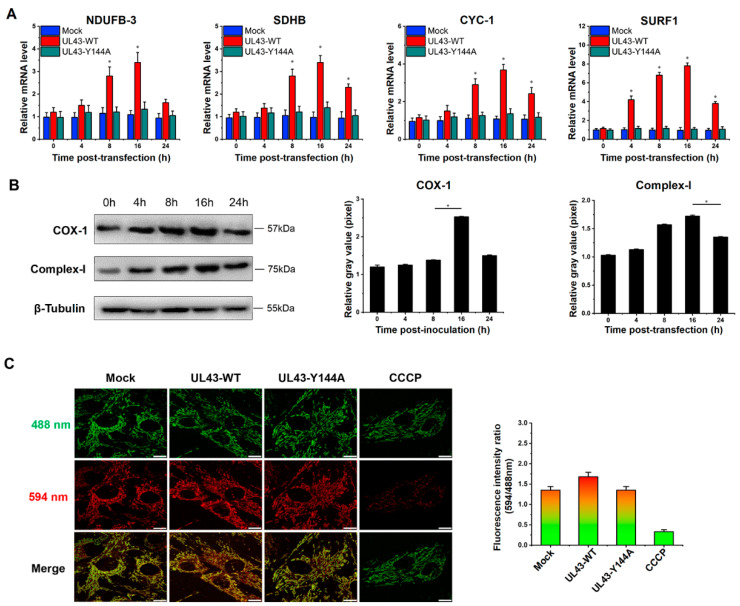
Figure 5.
UL43 transfection results in an abundance of mRNA, corresponding to several OXPHOS-related enzymes. UL43-WT, UL43-Y144A and Mock cells were detected at 0, 4, 8, 16 and 24 h. (A) Quantitative analysis of the mRNA expression level of NDUFB3, SDHB, CYC1 and SURF1 by qRT PCR. (B) Western blot analysis and grayscale quantification statistics are used to analyze the expression level of Complex-I and COX-I, *: p < 0.05. (C) Fluorescence image of mitochondrial membrane potential analysis and quantitative analysis of fluorescence ratio.

