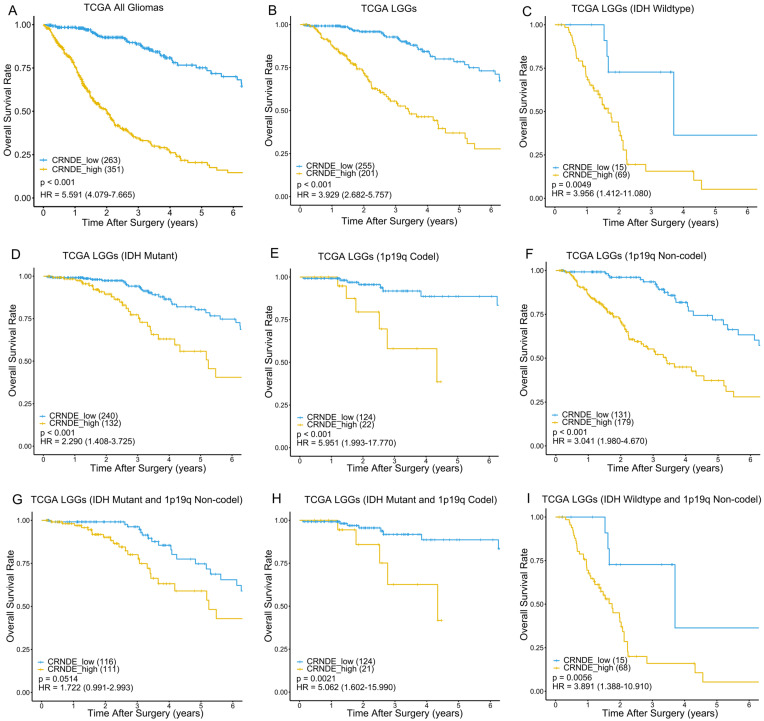
Figure 2.
Kaplan–Meier survival curves of the high- and low-expression groups according to IDH and 1p19q status in TCGA dataset. Kaplan–Meier survival analyses were performed on (A) 614 glioma patients, (B) 456 LGG patients, (C) 84 patients with wildtype IDH, (D) 372 patients with IDH mutation, (E) 146 patients with 1p19q codeletion, (F) 310 patients without 1p19q codeletion, (G) 227 patients with IDH mutation and without 1p19q codeletion, (H) 145 patients with IDH mutation and 1p19q codeletion, and (I) 83 patients with wildtype IDH and without 1p19q codeletion.

