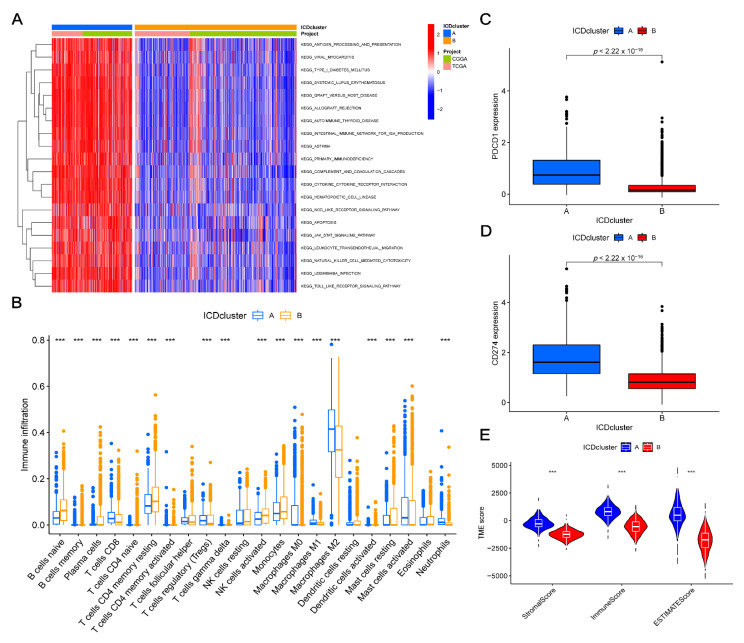
Figure 3.
Correlations between the TME and two ICD-related gene clusters. (A) GSVA between the two clusters for biological pathways. The red indicates positive correlation, and the blue indicates negative correlation. (B) Differences in the 22 immune cells between clusters A and B. (C,D) Difference in the PDCD1 and CD274 expression levels between clusters A and B, respectively. (E) Relationships between two clusters and TME scores. ***, p < 0.001; ICD, immunogenic cell death; GSVA, gene set variation analysis; TME, tumor microenvironment.

