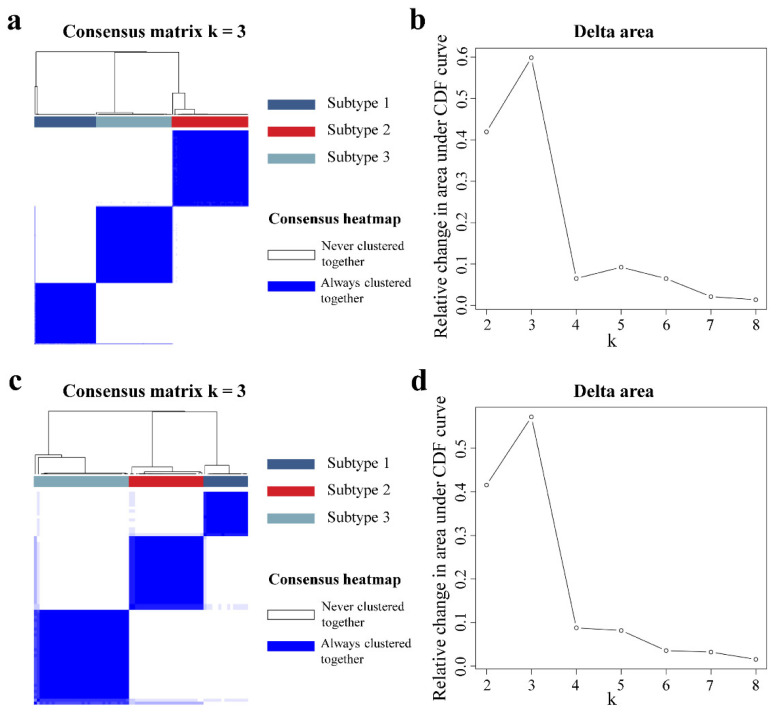
Figure 2.
Unsupervised consensus clustering of DCE-MRI features. In the imaging-subtype discovery (a) and validation cohorts (c), the consensus matrix heatmaps for the optimal cluster number (k = 3) are displayed. Rows and columns of the consensus matrix were samples and values ranging from zero to one, indicating the two samples never clustered together or always clustered together, respectively. The dendrograms above the heatmaps indicate the samples ordering in three subtypes. The cluster number k varied from 2 to 8, and the optimal k could be determined to be 3 when yielding the largest relative change in area under the cumulative distribution function (CDF) curves for both the discovery (b) and validation cohorts (d).

