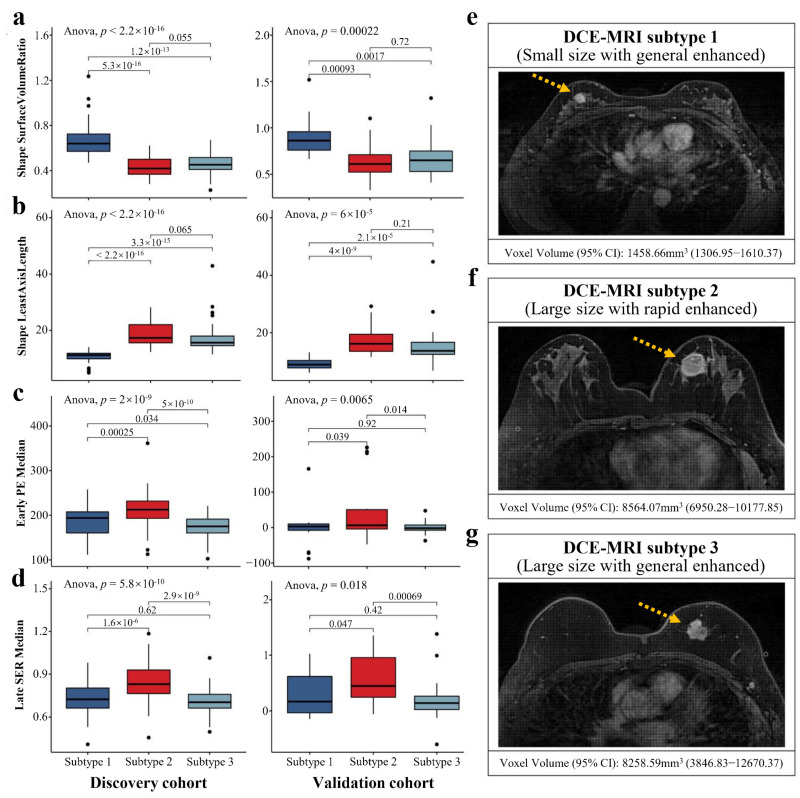
Figure 3.
Significant differences in tumor sizes and enhanced patterns shaped the imaging subtypes. Three subtypes were significantly associated with four representative quantitative imaging features in both cohorts, including surface volume ratio (a), least axis length (b), early PE map median (c), and late SER map median (d). ANOVA was used to identify the differences in imaging features among three subtypes, and Student’s t-test was used for the comparison between two subtypes. The mean values with 95% CI of the selected imaging feature and the representative sample from the discovery cohort for each imaging subtype are illustrated in (e–g) (yellow arrows point to the tumors).

