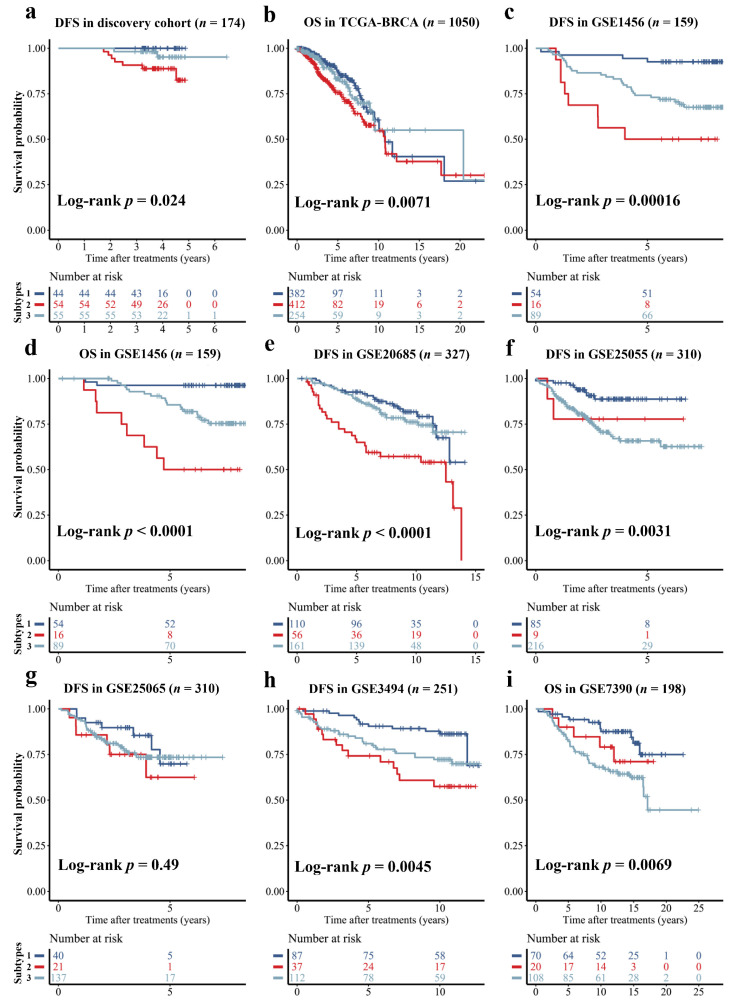
Figure 4.
Prognosis of DFS or OS stratified by the DCE-MRI subtypes. The Kaplan-Meier curve was plotted for the stratified samples by three imaging subtypes in the discovery cohort (a), and evaluated in seven external datasets without imaging data but by using a gene-profile-based imaging subtypes classifier to determine the imaging subtypes (b–i).

