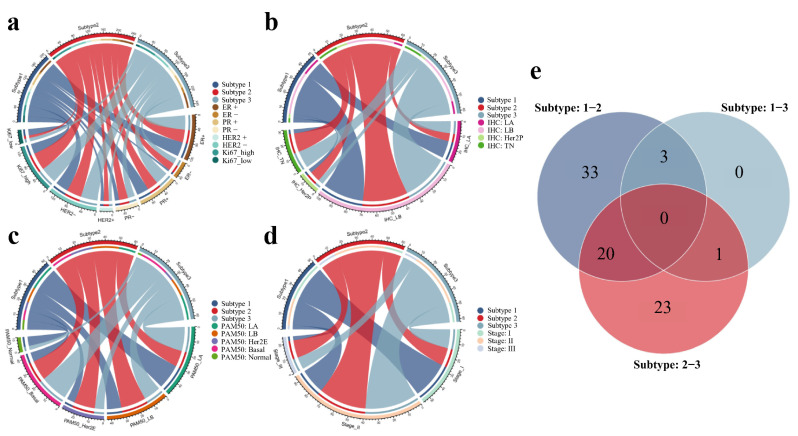
Figure 5.
Associations of the DCE-MRI subtypes with clinical and pathway characteristics. The chord diagrams between three imaging subtypes and clinical IHC receptors (a), IHC-based subtypes (b), PAM50 molecular subtypes (c), and clinical stages (d) in the discovery cohort were described. Venn diagram of the differentially enriched KEGG pathways between two of three imaging subtypes (e).

