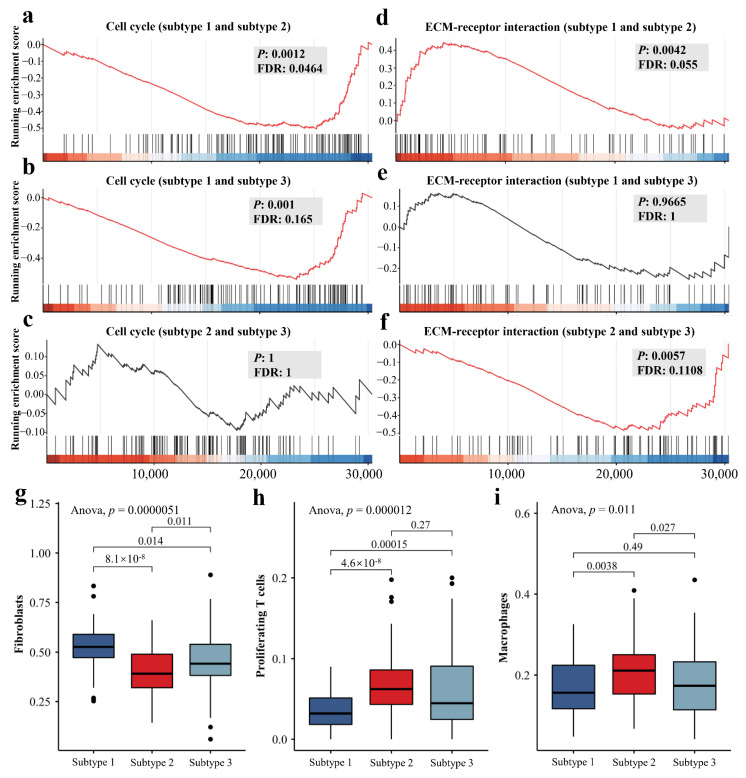
Figure 6.
Important enriched KEGG pathways and tumor microenvironment characteristics of different DCE-MRI subtypes. Detailed differences in representative transcriptional behavior among three subtypes including cell cycle (a–c) and ECM-receptor interaction (d–f) are illustrated. The boxplots for the fractions of cancer-associated fibroblasts (g), proliferating T cells (h) and macrophages (i) among imaging subtypes in both discovery and validation cohorts are displayed. ANOVA was used to identify the differences in cellular fractions among three subtypes, and Student’s t-test was used for the comparison between two subtypes.

