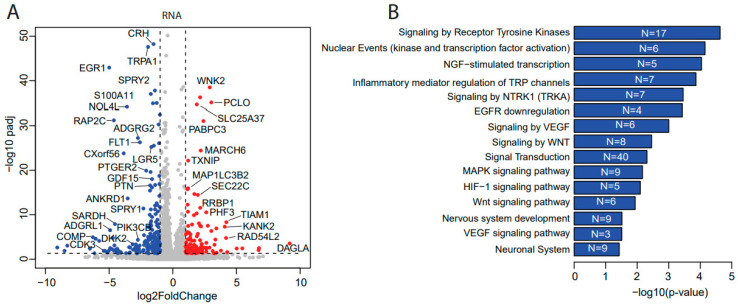
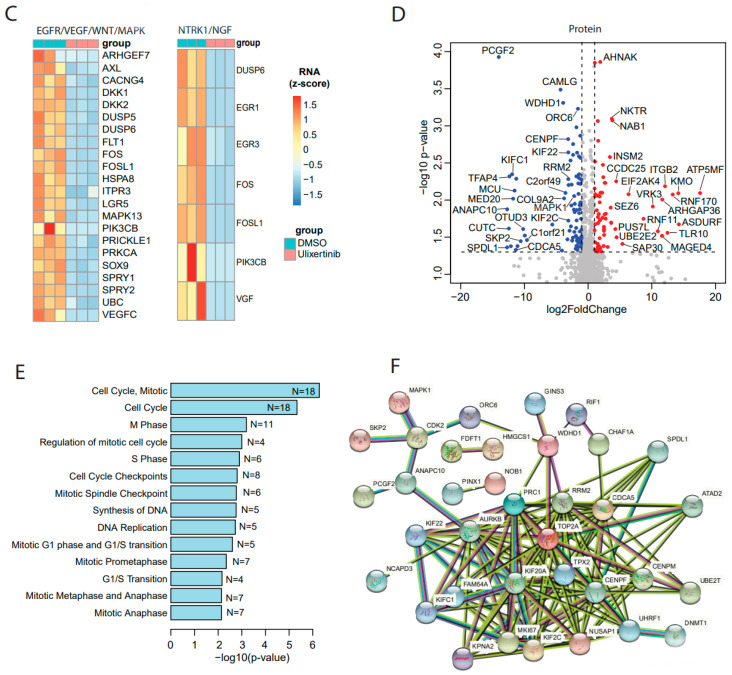
Figure 3.
Transcriptomics and proteomics reveal ulixertinib-induced gene changes in NGP cells. (A) The differentially expressed genes revealed by DESeq2 analysis of RNA-Seq read counts. They are represented in the volcano plot in terms of their measured expression change (log2 of fold changes, x-axis) and the significance of the change (−log10 of adjusted p values, y-axis). The dotted lines represent the thresholds to define the differentially expressed genes. Red dots are up-regulated genes after the drug treatment (fold changes ≥ 2 and adjusted p < 0.05). Blue dots are down-regulated genes with the drug treatment (fold changes ≤ 0.5 and adjusted p < 0.05). (B) Top inhibited pathways revealed by down-regulated genes from RNA-Seq. N is number. (C) Key components inhibited and their associated pathways. (D) The differentially expressed proteins from MS were represented in the volcano plot in terms of their measured expression change (log2 of fold changes, x-axis) and the significance of the change (-log10 of p values, y-axis; unpaired t-test). The dotted lines represent the thresholds to define the differentially expressed proteins. Red dots are up-regulated proteins after the drug treatment (fold changes ≥ 2 and p < 0.05). Blue dots are down-regulated proteins with the drug treatment (fold changes ≤ 0.5 and p < 0.05). (E) Top inhibited pathways revealed by downregulated proteins from MS. N is number. (F) Protein–protein interaction networks analysis of down-regulated proteins from MS.


