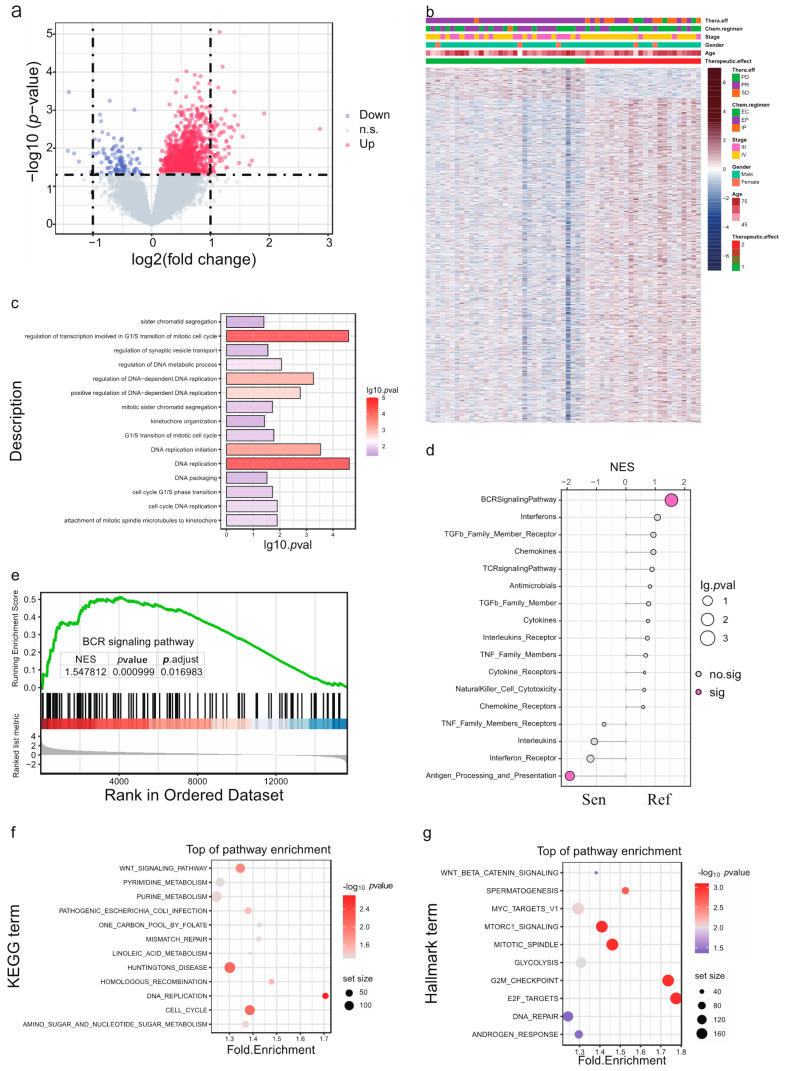
Figure 2.
ExLR-seq analysis of patients with SCLC. (a) Volcano plot and (b) hierarchical clustering of differential expressed exLRs between chemo-sensitive and chemo-refractory groups. (c) GO analysis of the differentially expressed exLRs. (d) Enrichment score comparisons for immune-related pathways. (e) BCR signaling pathway enriched in the chemo-refractory group by gene set. (f) KEGG pathway analysis. (g) Enrichment score comparisons for hallmark analysis. GO: gene ontology; KEGG: Kyoto Encyclopedia of Genes and Genomes.

