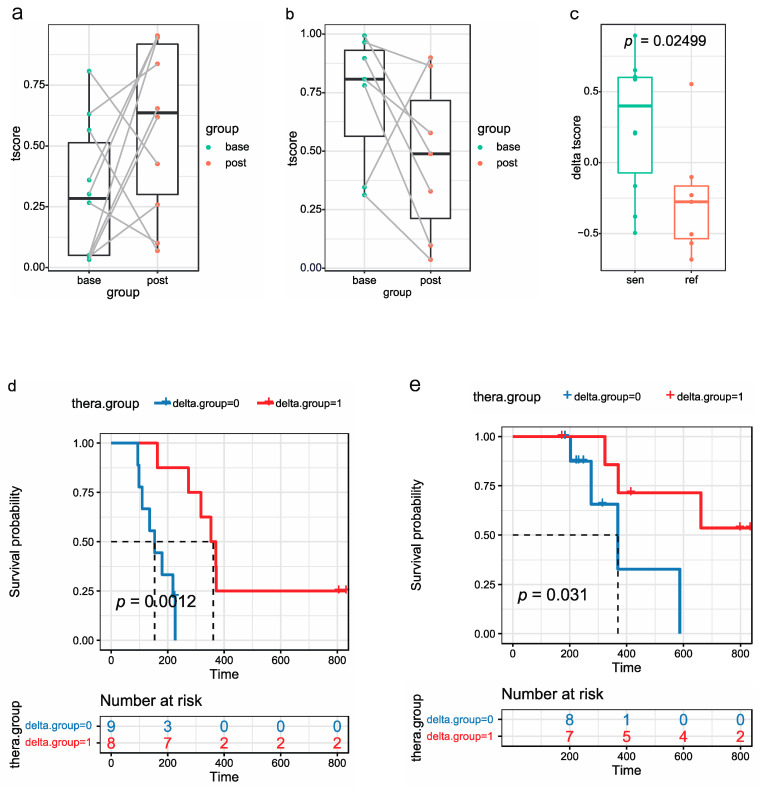
Figure 5.
T-scores of paired samples at baseline and after 2 courses of chemotherapy. T-scores of chemo-sensitive (a) and chemo-refractory (b) groups at baseline and after 2 courses of chemotherapy. (c) T-score difference in chemo-sensitive and chemo-refractory groups. Kaplan–Meier survival analysis (log-rank test) of PFS (d) and OS (e) of SCLC patients with high and low t-score differences.

